In life, people often look forward to the continued rise in housing prices. Similarly, in the stock market, many investors also hope that the rising Stock Prices can appear to retrace. This market sentiment not only reflects the general psychology of investors but also may actually affect the price of the stock up or down. As a result, the Behavioural Indicator of Absence (BIAS) is widely used in investor circles as an analytical tool designed to help investors identify the risk of a possible pullback in a rising stock price. In the next section, we will discuss the BIAS indicator and its application techniques in detail.

What does Deviation Ratio mean?
Its English name is Bias Ratio, which is a technical analysis indicator used to measure the degree of deviation between the price of a financial asset and its moving average. It helps investors to determine whether the market is overbought or oversold and whether there is a possibility of a price retracement.
One of its theoretical origins can be traced back to Granville's Law, which states that share prices will always revert to their long-term average. This idea is based on the "mean reversion" effect that exists in the market, which means that after a significant deviation, the price of a stock usually tends to converge to its average level.
This theory is based on the analysis of investor psychology, which suggests that price deviations reflect fluctuations in market psychology. When the stock price deviates too much from its moving average, the psychological tendency of investors tends to push the stock price back towards its average. Therefore, this indicator also reflects the impact of market sentiment on stock price movements.
Specifically, when the stock price is significantly above the SMA, overheated market sentiment may cause investors to begin to worry about the risk of a pullback, which could drive the stock price down and back towards the SMA. Conversely, when the stock price is significantly below the SMA, excessive pessimism in the market may trigger buying interest from investors, pushing the stock price to rally and move closer to the SMA.
As a measurement tool for this theory, the BIAS indicator helps investors assess the likelihood of a stock price reverting to its mean by calculating how far the stock price has deviated from the mean. And the calculation process is relatively simple, as it can be derived by converting the gap between the current price and the moving average into a percentage. The specific formula is Deviation = (Current Price - Moving Average) Moving Average x 100 percent.
Among them, the moving average (MA) is the average of the stock price in a certain period of time; the common cycle includes 6 days, 12 days, 24 days, etc. And the current price is usually the closing price. Assuming that today's closing price is $90 and the average price of the past 24 days is $100. then the deviation = (90-100)100=-10%.
At the same time, the BIAS indicator is effective in revealing extreme states of the market, such as overbuyt or oversold. It shows significant positive or negative values when the price deviates too far from the moving average, thus helping investors to recognize when the market is overbought or oversold. This information provides investors with key clues to identify potential pullback or rally opportunities.
By looking at these extremes, investors can recognize if the market is experiencing excessive rallies or declines and also be able to adjust their investment strategy to avoid risk or take advantage of rebound opportunities when appropriate. Using the signals provided by Deviation Ratio at the right time can effectively optimize investment decisions and reduce potential risks while seizing opportunities arising from market reversals.
Moreover, the deviation ratio may give frequent buy and sell signals in a market environment with high price volatility. Such frequent signaling can sometimes lead investors to make too many trades, thereby increasing trading costs. Commissions and slippage fees may be incurred on each trade, and over the long term, these costs may have a negative impact on overall investment returns. Therefore, investors need to be careful in interpreting the signals when using them to avoid adding unnecessary costs by Overtrading.
Of course, using the deviation ratio in isolation may result in an incomplete analysis. This is because, by itself, it mainly reflects the extent of price deviation from the SMA and cannot cover all market information. To improve the accuracy of decision-making, investors should use it in combination with other technical indicators (e.g., MACD, RSI, etc.). These indicators can provide a more comprehensive analysis of market trends, momentum, and overbought and oversold situations, thus helping investors make more scientific investment decisions.
As Warren Buffett said, grasping changes in market sentiment can provide investors with excellent investment opportunities. As a result, Deviation Ratio, as a simple but effective analytical tool, plays an important role in investors' daily trading. It helps investors identify extreme states of the market and provides a convenient tool for adjusting investment strategies and seizing market opportunities.

How to read the Deviation Indicator
As an indicator that measures the degree of price deviation from a moving average, its main function is to help investors identify overbought and oversold states in the market. By understanding and interpreting the deviation ratio, investors can more accurately identify overreactions in the market so that they can adjust their investment strategies in a timely manner, seize potential opportunities in the market, and optimize their trading decisions.
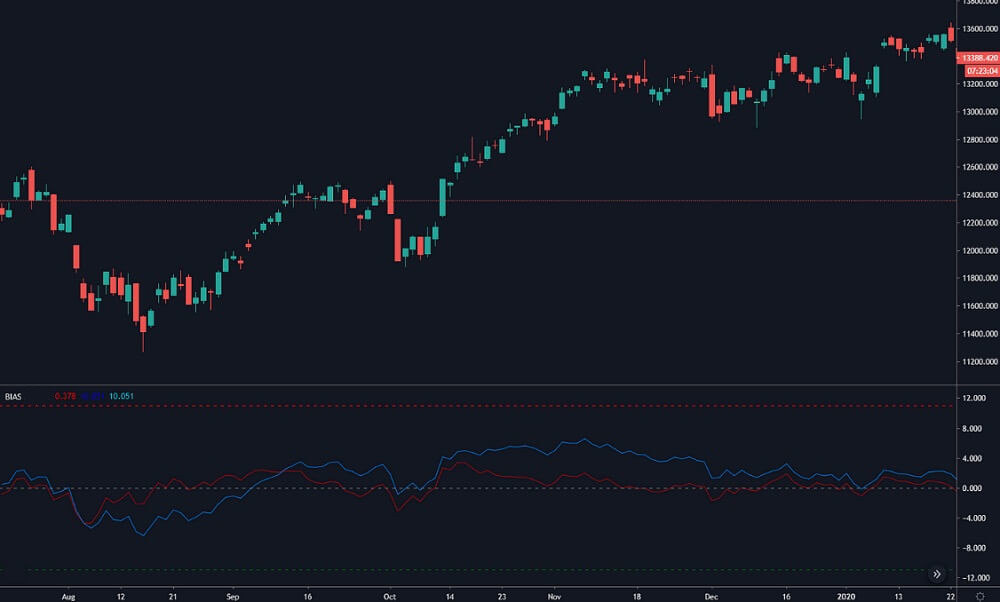
By calculating it, investors can first distinguish whether it belongs to a positive or negative value. Generally speaking, when the stock price is above the moving average, the deviation ratio is positive. This indicates that the market is in an overbought state when the price has a large deviation relative to the moving average. In other words, this usually means that the market has risen too quickly in the short term and there is a risk of a pullback. This level of deviation can help investors decide if they need to adjust their strategy or consider taking profits.
Typically, when the BIAS exceeds 8% or 10%, the risks tend to outweigh the benefits. In this case, the market may have overheated and investors may sell quickly to lock in profits. Short-term traders and retail investors, in particular, may act quickly for fear of a price pullback, thus increasing market volatility. As such, this is usually a warning signal to remind investors to be cautious in the current market conditions.
And when the stock price is below the moving average, the deviation is negative. It indicates that the market is in an oversold state when the price has deviated significantly relative to the moving average. In other words, this usually means that the market's short-term decline has been too fast and there may be some potential for a rebound. This level of deviation can help investors identify potential buying opportunities or assess whether it is necessary to adjust their position strategy.
The higher this negative value is, the more the stock price is moving away from the mean, which often creates momentum for a rally. Just as a ball pressed into water has a natural tendency to float upwards, when a stock price falls excessively below the SMA, the market may experience some corrective force that pushes the stock price back near the SMA. As a result, this is usually a bounce signal, suggesting that the market may be experiencing a price rally.
And depending on the degree of deviation between the price and the moving averages, if its value is large, it usually indicates that the price has deviated significantly from the averages, signaling that the market may be overbought or oversold. If the BIAS value is small, it means that the price deviation from the average is small, the market is in the normal range of fluctuations, the price change is more consistent with the average, and the trend is relatively smooth.
When it is large and consistently positive, it usually indicates that the market is overbought and a price correction may occur. At this point, investors should be cautious and consider reducing positions or watching to avoid losses. When the deviation is large and consistently negative, it usually means that the market is oversold and prices may rebound. Investors may consider building or adding to their positions to take advantage of a potential rally.
When the deviation remains within a moderate range and in line with the trend of the price, this is usually seen as a signal that the market trend is stable and likely to continue. In this case, the BIAS not only helps traders to confirm the strength of the current trend but also indicates the direction of the trend, thus providing strong support for developing precise trading strategies.
When the BIAS shows extreme values and begins to regress, it usually signals a possible reversal of the market trend. For example, a very high positive BIAS or a very low negative BIAS may indicate that the market is overbought or sold. And when the BIAS indicator reverts to the mean, it may signal a trend reversal. Investors should observe this process to capitalize on the timing to adjust their investment strategy.
When interpreting the BIAS indicator, it is also important to look at its period parameters. Generally speaking, short-term BIAS (such as 5 days) for short-term trading can quickly reflect the short-term price fluctuations to help traders grasp short-term opportunities. Long-term BIAS (e.g., 50 days), on the other hand, is suitable for long-term investment, analyzing changes in long-term trends and providing investors with a sound basis for decision-making. Using a combination of short-term and long-term deviation ratios can more accurately grasp market movements and optimize investment strategies.
It can also be combined with other technical indicators such as MACD, RSI, and kdj, which can significantly enhance the accuracy and reliability of the analysis. MACD helps to identify changes in trends, RSI provides overbought or oversold signals, and KDJ shows price extremes. By combining these indicators, investors are able to analyze the state of the market in a more comprehensive manner and thus make more scientific trading decisions.
In conclusion, Deviation Ratio, as a simple but effective analytical tool, can help investors identify potential buy and sell signals in the market. At the same time, it should be analyzed in conjunction with other technical indicators and market fundamentals to form a more comprehensive investment decision and improve the success rate of investment decisions.

Tips for using Deviation Ratio
Although, as a simple analytical tool, it can effectively provide overbought or oversold signals of the market, relying on it alone to formulate investment strategies is not sufficient. BIAS interpretation alone may ignore the complexity and dynamics of the market. Therefore, investors should comprehensively analyze a wide range of factors in practical application in order to formulate more accurate and scientific investment decisions.
For example, it is generally used to refer to overbought or oversold status when prices are volatile. For example, when the 5-day SMA BIAS indicator reaches 5%, it is usually regarded as a high deviation; when the 10-day SMA BIAS reaches 7%, the degree of deviation is even greater; and when the 20-day SMA BIAS reaches 12%, it indicates that there is a more significant deviation between the price and the SMA. These different levels of deviation can help investors assess the extremes of the market and thus better capitalize on possible retracement or rebound opportunities.
And in the stock market, different types of stocks have different levels of sensitivity to BIAS. Typically, large-cap stocks may have a relatively small reference value for this indicator due to their higher stability. Smaller stocks, on the other hand, tend to have more drastic price fluctuations due to their smaller market capitalization and relatively less liquidity, so the reference value of the BIAS is set higher.
This means that the BIAS for large-cap stocks may indicate an overbought or oversold state of the market within a smaller range of deviations, while small-cap stocks may indicate similar market conditions within a wider range of deviations. Investors should adjust their reference values according to the type of stock and market characteristics in order to more accurately assess market conditions.
Moreover, because the formation and change of market trends are affected by a variety of factors, relying on the BIAS indicator alone to make buy and sell judgments may lead to misjudgments. For example, the market may continue to rise due to strong fundamentals or other technical signals, and even if it shows overbought, there may not be an immediate pullback.
Also, news changes, market sentiment, and other factors can affect the size of the BIAS. For example, when there is a major news event in the market, such as the release of a company's earnings report, a policy change, or an update on macroeconomic data, all of this information may have an immediate impact on the stock price, causing it to fluctuate abnormally, so relying on the Deviation Ratio alone may not be comprehensive enough.
In practice, BIAS may fail to reach the expected highs when the price rises sharply, for example, over $1.000. which may lead investors to mistakenly believe that the market is not yet overheated. Therefore, it should be used in conjunction with other technical indicators and market analysis methods to improve the accuracy and comprehensiveness of the judgment.
In addition, different types of trading require different BIAS interpretations. For example, in short-term trading, when the positive BIAS becomes large, investors should be alert to possible price retracements and consider reducing positions at the right time to lock in profits. At this point, the stock price may have moved away from the SMA and the market may be overbought, leading to an increased risk of a pullback. By monitoring changes in the deviation ratio, short-term traders can adjust their strategies in time to prevent losses due to market pullbacks.
For medium- and long-term holders, before the stock price returns to the mean, they can continue to hold their investment and wait for the market to retrace to near the mean before considering selling. Changes in the deviation ratio can help determine the market's adjustment trend, so that when the stock price is close to the average, according to the market situation, you can make the appropriate decision to sell and optimize the position strategy.
When negative divergence is high, although there may be a rebound, the rebound is often short-lived. Therefore, investors should not go long blindly but should carefully observe the market trend and assess the sustainability and strength of the rebound to avoid the potential risks associated with short-term fluctuations.
In conclusion, the deviation ratio is mainly used to judge short-term overbought or oversold status and is of limited use in judging the overall general trend. Therefore, investors should combine other technical indicators and market analysis methods to comprehensively judge the market trend. In this way, we can better identify market opportunities and risks and develop more accurate and adaptable trading strategies.
Tips for applying the Deviation Indicator
| Application Tips |
Description |
| Setting the appropriate period |
Choose a moving average period (e.g., 5, 10, 20 days) for volatility. |
| Observing extreme values |
Extreme deviation (>8% or -8%) indicates potential reversal. |
| Combine with other indicators |
Use deviation ratio with RSI and MACD for better signals. |
| Watch for trend changes. |
Track Deviation Ratio to spot trends and reversals. |
| Setting Stop Loss Points |
Set stop-loss points with the Deviation Ratio to manage risk. |
Disclaimer: This material is for general information purposes only and is not intended as (and should not be considered to be) financial, investment, or other advice on which reliance should be placed. No opinion given in the material constitutes a recommendation by EBC or the author that any particular investment, security, transaction, or investment strategy is suitable for any specific person.


