When it comes to technical analysis in investor circles, Gann Theory is undoubtedly an important topic that cannot be ignored. Although this method of analysis was first proposed in the 1920s, it is still widely circulated in today's investing world, is still vibrant, and continues to influence many investors through the test of time. Now, let's explore the mysteries of this legendary investment methodology and gain a deeper understanding of the core ideas and application techniques of the Gann Theory.
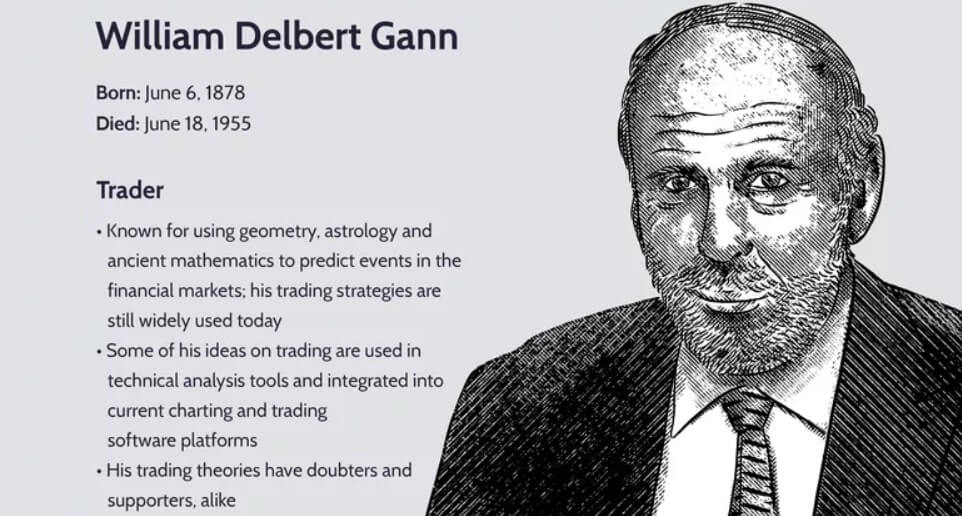
What is Gann Theory?
It is a technical analysis method developed by William D. Gann that is widely used in the prediction and analysis of stock, futures, and foreign exchange markets. The theory is based on the relationship between market cycles, price, and time and argues that changes in market prices are regular and can be predicted mathematically and geometrically.
The core concepts of the Gann theory include the Gann Angle Line, the Gann Grid, the Gann Time Cycle, the Gann Numbers, and the Gann Sector. Combining geometry, astronomy, and mathematics, these tools are designed to reveal the inner workings of the market and help investors analyze price trends, support resistance, and cyclical fluctuations.
Gann theory suggests that there is a symmetrical relationship between time and price and that market fluctuations are not only affected by price movements but are also closely related to time cycles. Gann emphasizes the cyclical nature of the market, believing that the market will repeat previous trends and fluctuations within a given time period. Gann angles, one of his core tools, are used to analyze the support and resistance of market prices in different time cycles and, at the same time, to predict key turning points in the market through the squared relationship between price and time.
In addition, Gann employs natural laws such as the Golden Section and the Fibonacci sequence, which suggest that market movements follow cycles and ratios similar to those found in nature. These natural laws help to reveal the cycles and patterns within the market and provide a powerful tool for predicting market movements.
Through Gann Angle Lines and Gann Grids, Gann theory helps to analyze market price movements and key levels, while Gann Time Cycles and Gann Numbers provide tools to predict market trends and changes. These analytical methods not only rely on historical market data but also incorporate the time and price characteristics of the market in an attempt to find patterns and regularities that are instructive in a complex market environment.
The strength of the Gann Theory is that it provides a comprehensive framework for market analysis, including time cycles and price forecasting. Through tools such as Gann Angle Lines and Gann Time Cycles, it helps investors identify support and resistance levels as well as market turning points. Combined with geometry, mathematics, and natural laws, it systematically reveals market cycles and price fluctuations to help investors develop effective trading strategies.
For investors who are proficient in mastering and applying Gann's theory, this theory can help to accurately predict key turning points in the market. By combining time cycles and price forecasts, investors are able to identify important market support and resistance levels and thus develop more accurate trading strategies.
And it is not only widely used in the stock market, but its scope of application also covers a wide range of financial markets such as futures, foreign exchange, and commodities. By analyzing the relationship between market cycles, price, and time, this theory provides systematic forecasting and analysis tools for trading various financial assets, enabling investors to apply the same analytical framework in different markets to identify potential trading opportunities and key market turning points.
However, despite the systematic analytical tools provided by Gann's theory, different investors may come to different conclusions about the same market situation due to the complexity of market conditions and differences in individual investor interpretations. This subjectivity makes it possible to show strong individual differences in its practical application, affecting the accuracy and consistency of predictions.
Moreover, it was born in the early 20th century, and with the changing market environment and technological advances, some investors are concerned that its validity may be compromised, especially in markets where modern high-frequency trading and algorithmic trading are prevalent. These emerging trading techniques and market dynamics may make the traditional Gann theory challenging, requiring investors to reassess its applicability in contemporary markets.
In addition, Gann theory involves complex mathematical and geometric analyses, covering a number of advanced tools and methods such as Gann Angle Lines and Gann Grids. For beginners, these tools and methods not only require in-depth theoretical understanding but also practical operational experience, so they need to invest a lot of time and effort in systematic learning and practice in order to master the core principles of the theory and application skills.
In conclusion, Gann Theory, as a time-honoured method of technical analysis, offers a unique perspective on market analysis, particularly in terms of time cycles and price forecasting. It can be a powerful analytical tool for investors who are willing to invest time in in-depth study and research. However, due to its complexity and subjectivity, investors need to be cautious when applying it, and it is best to combine it with other analytical methods and market tools to enhance the accuracy of their decisions.
 The main essence of Gann's theory
William D. Gann (W.D. Gann) believed that market movements follow intrinsic laws, especially in terms of the symmetry of time and price and their periodicity. His theory emphasizes that market fluctuations are not only random but regular and that the relationship between time and price can be revealed through geometric and mathematical models to predict market movements.
Gann believed that time and price are two crucial elements in market analysis and that there is a profound symmetrical and proportional relationship between them. In his analytical framework, the symmetry of time and price is seen as the key to predicting market turning points. By examining these symmetries and proportionality Gan's theory is able to reveal potential changes and key turning points in the market, thus providing investors with a strategic basis for decision-making.
Gann developed the concept of ‘time equals price’, which suggests that a market may turn when price movements are proportional to the time period. This suggests that price and time are interrelated, and by analyzing their proportionality, key market reversal points can be predicted.
Gann believed that market movements are cyclical, with market highs and lows repeating themselves over a specific time cycle. This cyclicality is not only influenced by historical events but can also be influenced by natural phenomena and other factors. Identifying and understanding these cyclical patterns is therefore critical to market forecasting.
Gann theory uses historical data to analyze the cyclicality of the market and predicts future market turning points by identifying key time cycles such as 90 days, 180 days, and 360 days. This approach helps investors make more informed investment decisions by examining past market behavior and helping them to determine possible future market movements.
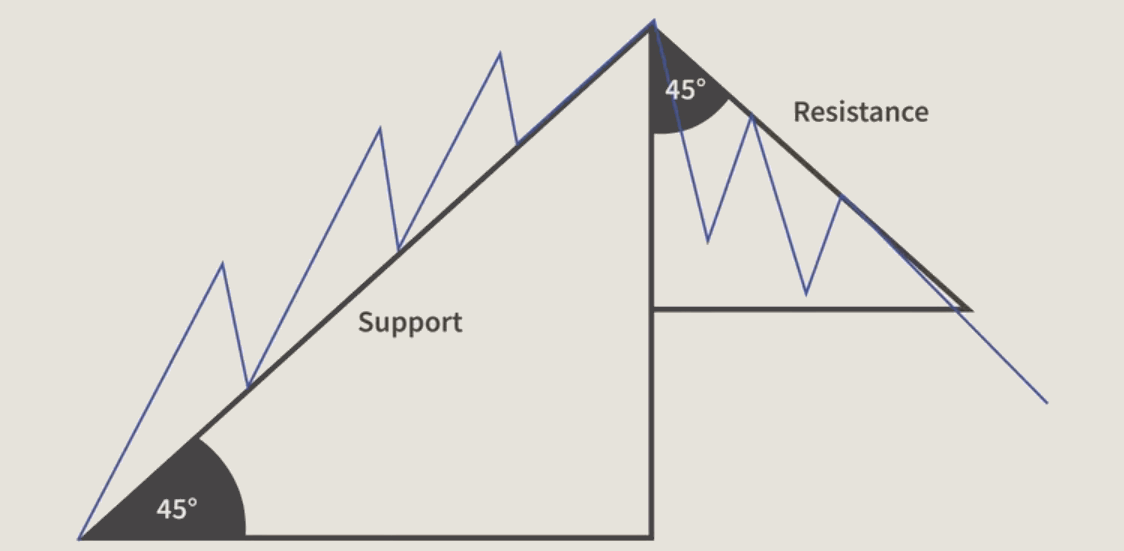
The Gann Angle Line is one of the key tools in the Gann Theory and is used to describe changes in market prices through different angles. The most commonly used is the 45-degree angle line (i.e., the 1:1 slope), which represents the equilibrium relationship between price and time and shows the symmetry of price and time. Other angle lines, such as 1:2. 2:1. etc., are used to indicate different strengths and trends in the market. These angle lines help to analyze price movements in the market and predict potential support and resistance levels.
The Gann Fan further helps identify support and resistance in the market by drawing multiple angle lines (including 45 degrees and multiples thereof) outwards from a given price point. A breakout or support of these angled lines usually signals a change in market trend. By using the Gann Fan, investors can more accurately analyze market movements and predict key reversal points so that they can develop trading strategies accordingly.
Gann proposes that there is a square relationship between price and time, where the square root of time is proportional to the square root of price. This relationship is used to predict key turning points in the market. By calculating the square of time and the square of price at an important turning point in the market, investors can predict the next possible turning point in the market.
Gann believed that market movements follow the fundamental laws of nature and the universe, such as the golden section and the Fibonacci sequence. These laws not only reflect cyclical changes in the market but also correspond to cyclical phenomena in nature and the universe. Gann's theory suggests that the up-and-down cycles of the market are closely related to these laws of nature, thus revealing the inherent cyclicality and regularity of the market.
By combining market cycles with natural laws, Gann theory attempts to capture the essence of market movements in order to predict future market movements. This approach not only relies on the analysis of historical data but also incorporates the cyclical patterns found in nature, thus providing a unique perspective to understand and predict market behavior.
A systematic theory developed by William Gann based on his extensive market experience and the combined application of mathematics and natural law, Gann's theory offers a unique approach to market prediction and has achieved remarkable success throughout history. Although its complexity makes it difficult for many investors to fully grasp, the essence of the theory and its methodology remain an important guide to market analysis and investment decisions.
Practical application techniques of Gann Theory
Gann theory provides investors with a systematic set of analytical tools to help them make trading decisions. Through comprehensive analysis of market support and resistance levels, time cycles, price movements, and other factors, investors can better grasp market trends, optimize investment strategies, and reduce risks.
When analyzing the stock market, you can start by drawing Gann Angle Lines to identify support and resistance levels, using key market highs and lows as a starting point. Angle lines with different slopes (e.g., 45-degree lines and their multiples) help identify major trends and potential reversal areas. By observing breakouts or support on angled lines, investors can determine changes in market trends and capture key turning points to develop effective trading strategies.
For example, consider buying when the market is near an all-time bottom and selling when it is near a top. However, caution should be exercised when encountering the fourth bottom or top. In an uptrend, a 5-7 point correction is usually a buy signal; in a downtrend, a 5-7 point rally is suitable for buying. 10-12 point rallies or corrections can also be used as a basis for operations.
Then use the Gann square to analyze and create a square grid of price and time. The grid divides the price and time axes equally to help identify key areas of support and resistance. Analyzing the location of these intersections can identify potential market reversal points. When price makes an unusual move or breaks out near a key intersection point, it usually signals a trend reversal. The Gann square provides a systematic perspective that helps to accurately predict market changes and adjust trading strategies.
Identifying and analyzing cyclical fluctuations in historical data is key when using Gann theory. By reviewing past market data, patterns between price fluctuations and time cycles can be identified. Based on these cycles, investors can predict future market reversal points and adjust their trading strategies at key moments.
Gann believes that cyclical market movements are determined by time cycles, usually every 10 years as a significant cyclical cycle. For example, a market top 10 years ago can be used to predict a market top 10 years from now. This approach helps investors to keep track of market rhythms and thus make more forward-looking investment decisions.
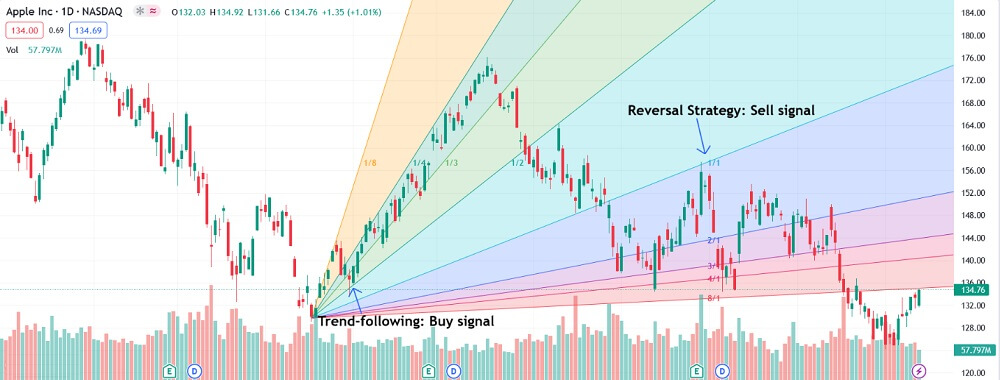
When applying the Gann Fan, a key price point is first selected as the starting point, and from this point, multiple fan lines are drawn, including 45 degrees and its multiples. These lines help identify support and resistance levels in the market. Observing how price reacts on these lines allows one to determine market trends and potential reversal points. When market prices break or touch these fan lines, it usually signals a trend change or reversal.
As shown above, by plotting the Gann fan chart, we can find different buy and sell points for trading. According to the trend trading strategy, consider buying when the price rises from the left key point. And when the price touches the 1:1 line, there is usually a reversal signal, at which point one can sell at that key point.
Calculating time periods involves in-depth analysis of historical market data to identify patterns of cyclical fluctuations. By measuring the time intervals of past price fluctuations, such as 90. 180. or 360 days, investors can identify market reversal points within these time cycles. Based on the patterns of these cycles, possible turning points in the market in the future are predicted, thus providing data to support investment decisions. This method helps investors to predict the timing of changes in market trends and improve the accuracy of their decisions.
Gann's analytical approach focuses on market sentiment and price fluctuations, which fits with modern behavioral finance. Behavioral finance suggests that investor sentiment and beliefs have a significant impact on market prices, often leading to price fluctuations that deviate from rational expectations. Gann theory reveals the laws of the market through geometric analysis, while behavioral finance explains the psychological factors behind these laws.
Gann theory also emphasizes the importance of stop-losses as a key measure to protect investors' capital. By setting reasonable stop-loss points, investors can exit in time when the market is not moving as expected, avoiding huge losses due to drastic price fluctuations and ensuring timely stop-losses when the market is not moving as expected.
In applying Gann's theory, it is also recommended to avoid over-trading and frequent changes in positions, especially in the absence of clear signals to maintain existing positions. This reduces the frequency of trades and commission charges, thereby increasing trading efficiency and reducing costs. With a stable investment strategy, investors are better able to capture market trends and optimize long-term returns.
In addition, Jahn recommends that investors avoid concentrating all of their money in a single investment and advocates limiting trades to less than 10 percent of the principal amount. This practice helps to diversify risk and avoid significant losses due to poor performance of individual investments. By spreading capital across multiple underlying investments, investors are able to reduce the risk of their overall portfolio while improving the chances of achieving consistent returns. This risk management strategy aims to protect capital and maintain investment flexibility in an uncertain market environment.
The practical application of the Gann theory requires not only an in-depth understanding of the market but also a combination of other technical analysis tools and market data. Investors should make comprehensive use of tools such as the Gann Angle Line and the Gann Sector and combine them with data on market trends, trading volumes, economic indicators, and other data to conduct a comprehensive analysis. Through this multi-level analysis, investors can more accurately grasp market trends, optimize trading decisions, and increase the probability of investment success.
Gann Theory Core Ideas and Application Techniques
| Core Idea |
Application Tips |
| Market prices have a cyclical fluctuation pattern. |
Predicting the Future with Historical Data |
| Time and price have a symmetrical relationship. |
Determining support and resistance levels |
| Price moves at a particular angle over time. |
Determining trend direction |
| The proportional relationship between time and price |
Identifying key price zones |
| Money management and stop-loss strategies |
Setting protective stops |
Disclaimer: This material is for general information purposes only and is not intended as (and should not be considered to be) financial, investment, or other advice on which reliance should be placed. No opinion given in the material constitutes a recommendation by EBC or the author that any particular investment, security, transaction, or investment strategy is suitable for any specific person.


 The main essence of Gann's theory


