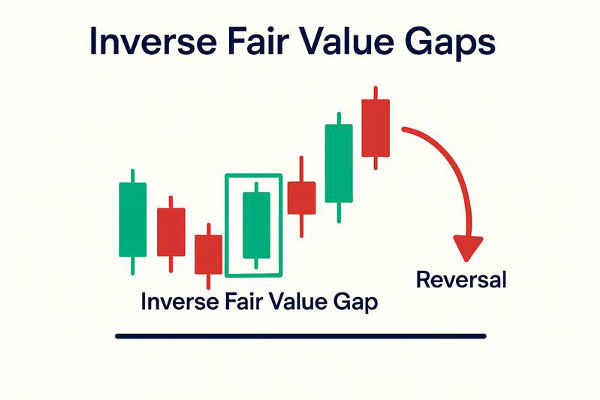
Technical analysts have employed candlestick patterns for many years to predict potential price movements in the financial markets. Among the numerous bullish reversal patterns, the Three Inside Up candlestick pattern is notable as a key signal of a potential shift from a downtrend to an uptrend.
But how reliable is it? This guide provides an in-depth exploration of the structure, psychology, trading techniques, advantages, disadvantages, and actual performance of the Three Inside Up pattern.
What Is the Three Inside Up Candlestick Pattern?
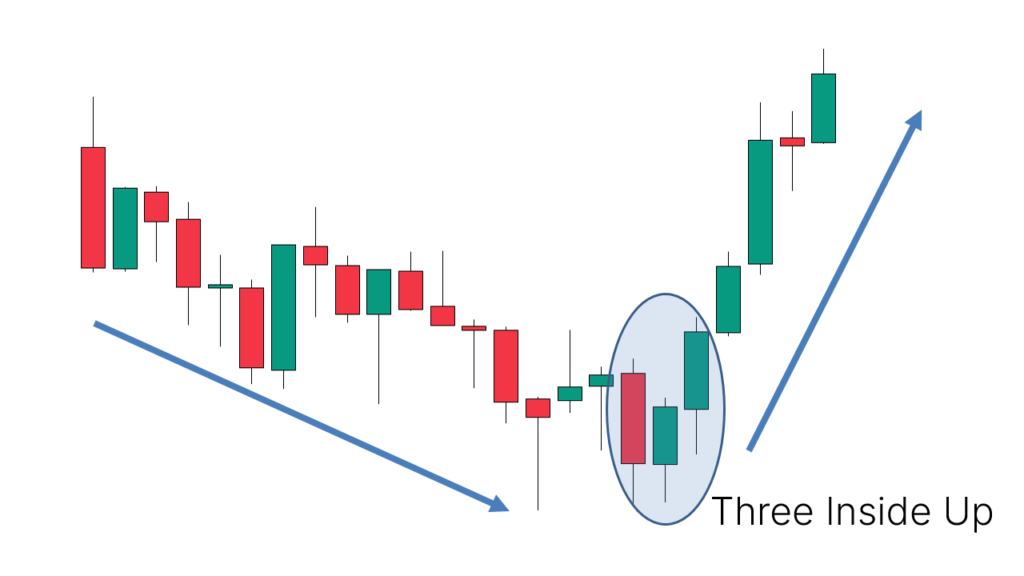
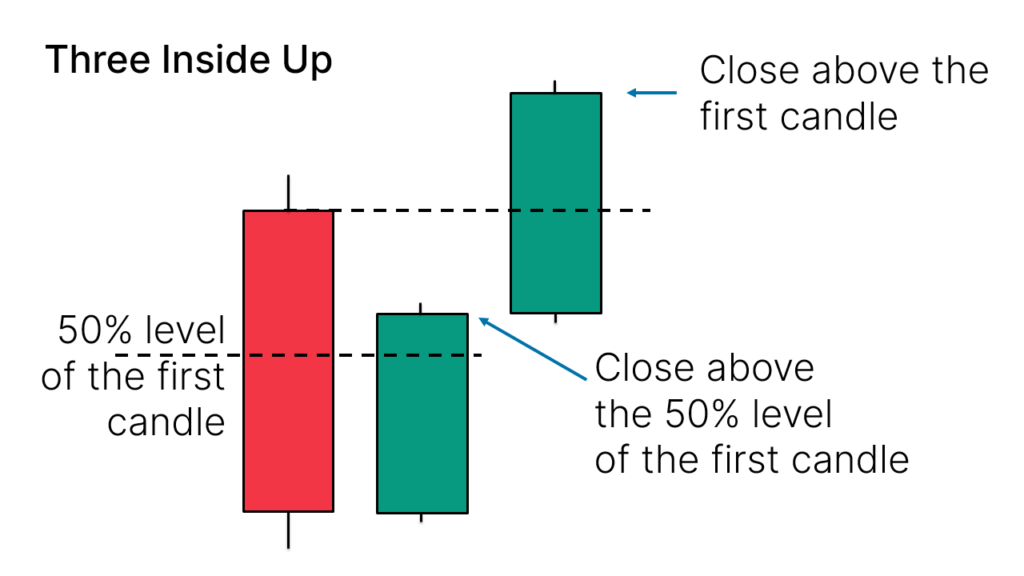
The Three Inside Up is a bullish candlestick reversal pattern that generally appears following a downtrend. It is composed of three candles:
A long bearish candle.
A smaller bullish candle that is completely contained within the body of the first candle (often resembling a Harami pattern).
A third bullish candle that closes above the high of the first bearish candle.
This trend suggests that the selling pressure is diminishing, and buyers are starting to assert control.
Candlestick Structure and Psychology
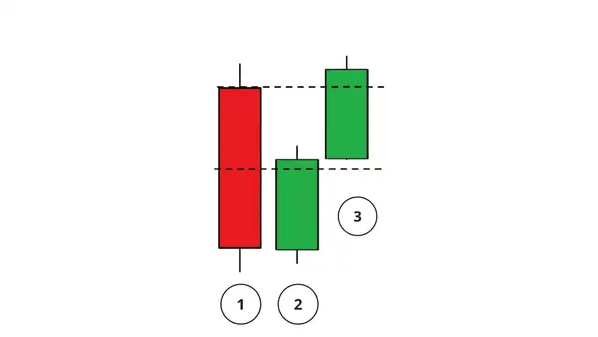
To understand how the Three Inside Up works, it's vital to grasp the psychological transition that takes place during the formation of these three candles.
Candle One (Bearish): The market is in a downtrend, and bears are confident, pushing the price lower. This long red (or black) candle indicates selling conviction.
Candle Two (Bullish, Small Body): Buyers begin. While not strong enough to overtake the previous bearish move, they contain the price within a narrow range. This candle is "inside" the body of the first candle, indicating potential reversal tension.
Candle Three (Bullish Breakout): Bulls confirm their strength by closing the price above the high of the first candle. This third candle indicates that momentum has shifted and a new bullish trend may be forming.
This blend indicates the shift from bearish dominance to bullish vigour—a strong visual cue of a market sentiment shift.
How to Trade the Three Inside Up Pattern
Step 1: Identify a Downtrend
The pattern must follow a visible downtrend. The longer the trend, the stronger the potential reversal.
Step 2: Spot the Pattern
Look for the exact structure: a large red candle, followed by a small green candle within the first, and a third green candle closing above the first candle's height.
Step 3: Confirm with Indicators
Use indicators like RSI (Relative Strength Index) to check if the market is oversold, or MACD to spot potential bullish crossovers. Volume spikes on the third candle also help confirm the reversal.
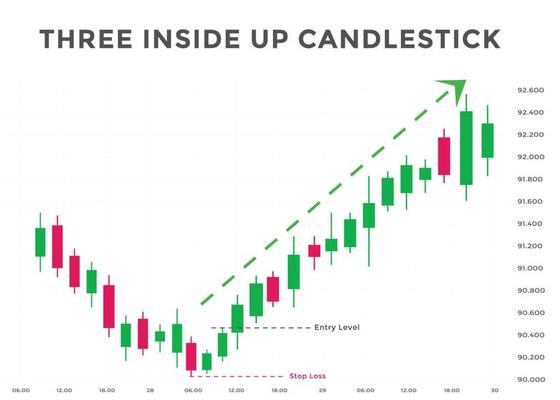
Step 4: Plan Your Entry
Most traders enter at the open of the candle following the third bullish candle. Conservative traders may wait for a pullback to the breakout level.
Step 5: Set Stop-Loss
A logical stop-loss is just below the low of the first bearish candle. It minimises risk if the pattern fails.
Step 6: Target Profit Levels
Traders often aim for previous resistance levels or use risk-reward ratios such as 2:1 to set profit targets. Trailing stops can help lock in gains as the price moves in your favour.
Best Assets and Timeframes for Trading the Pattern
The Three Inside Up can appear on all types of charts, but it is most effective on:
Stocks: Especially after earnings-related dips or market corrections.
Forex: Major currency pairs during the London and New York sessions.
Indices: S&P 500 and Nasdaq reversals offer good opportunities.
Commodities: Gold and oil during key demand zones.
Timeframes: Daily and 4-hour charts are more reliable than 1-minute or 5-minute charts.
Ultimately, its success depends more on confluence factors than the asset itself.
Real-World Example
Let's consider a historical example using Apple Inc. (AAPL) on a daily chart.
In a visible downtrend, the stock prints a long red candle. On the next day, a small green candle forms within the first. On the third day, the stock rises significantly and finishes above the height of the initial candle.
At the same time, RSI shows oversold conditions, and volume spikes on the third candle. A trader entering the position the next day could see a significant gain over the following sessions as the trend reversed upward.
How Reliable Is the Three Inside Up Candlestick Pattern?
While no pattern is 100% accurate, the Three Inside Up is considered relatively reliable when used with other tools.
According to backtesting studies on major currency pairs and stock indices, the Three Inside Up pattern has a success rate of approximately 65-70% when confirmed by volume and support zones. Here are some summarised findings:
Forex: The pattern performed most effectively on significant pairs such as EUR/USD and GBP/USD on the daily and 4-hour charts.
Stocks: High-performing patterns were identified in large-cap stocks and ETFs, particularly following declines in earnings.
However, its performance varies by asset class, timeframe, and market conditions. It is generally more reliable on higher timeframes, such as daily or weekly charts, than on intraday charts.
The pattern works best when:
Volume increases on the third candle
It forms after a steep downtrend
It aligns with oversold conditions or major support
Limitations and False Signals
Like all technical patterns, the Three Inside Up is not immune to false breakouts. The price might temporarily rise, only to revert to the earlier downward trend. These misleading signals frequently arise in volatile or sideways markets.
Additionally, during severe downtrends triggered by fundamental factors (such as disappointing earnings reports or worldwide crises), the pattern might not remain valid. In such cases, market sentiment can overpower technical signals.
That's why it's important not to trade this pattern in isolation. A comprehensive trading strategy that includes confirmation signals, rigorous risk management, and an understanding of macroeconomic factors is crucial.
Conclusion
In conclusion, the Three Inside Up candlestick pattern is a classic bullish reversal signal with a solid track record when used in a suitable context. It provides traders with a structured visual cue of market sentiment shifting from bearish to bullish, especially after prolonged downtrends.
While not foolproof, combining this pattern with support zones, volume analysis, and momentum indicators can yield reliable trading opportunities.
Disclaimer: This material is for general information purposes only and is not intended as (and should not be considered to be) financial, investment or other advice on which reliance should be placed. No opinion given in the material constitutes a recommendation by EBC or the author that any particular investment, security, transaction or investment strategy is suitable for any specific person.


