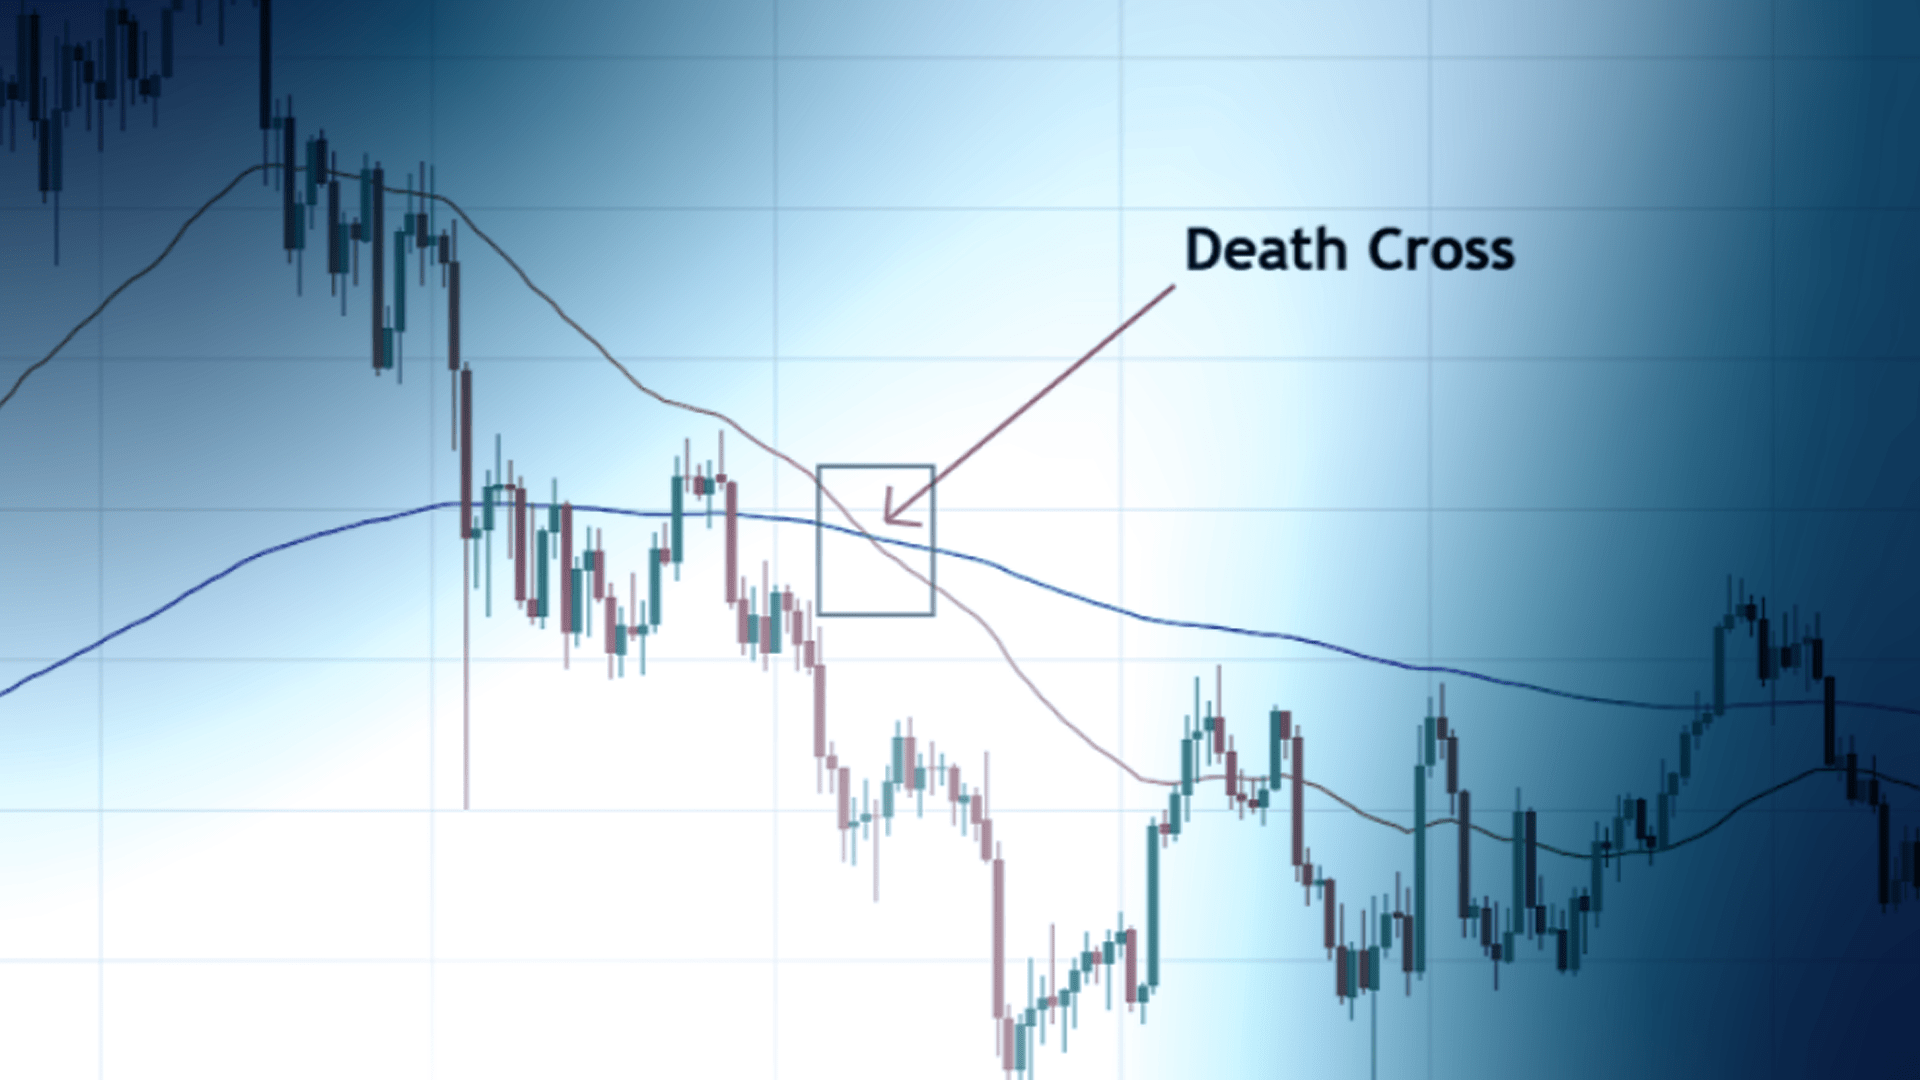
A death cross is one of the most well-known bearish signals. It occurs when a short-term moving average crosses below a long-term moving average, indicating potential downside momentum in the market.
Traders and investors watch for this signal, warning of a possible prolonged downtrend. While not always a guaranteed indicator of a market crash, the death cross is often associated with significant declines in stocks and commodities.
Real-World Historical Examples

The death cross has occurred in major market crashes and prolonged bear markets. Historically, it has appeared before significant economic downturns, such as the 1929 stock market crash, the 2008 financial crisis, and the 2020 COVID-19 market collapse. While not every death cross results in a severe market decline, it often warns traders to prepare for increased volatility and potential losses.
One of the most notable instances of the death cross occurred in 2008, just before the global financial crisis. As the housing market collapsed and financial institutions struggled, stock markets experienced sharp declines. The death cross appeared in major indices, such as the S&P 500 and the dow jones industrial average, reinforcing the bearish outlook.
Despite its historical significance, not every death cross leads to a prolonged downtrend. Sometimes, the market recovers quickly, leading to a false signal. This is why traders often use additional technical indicators to confirm the validity of the death cross before making trading decisions.
Understanding the Death Cross
The death cross represents a bearish signal, suggesting the beginning of a downtrend. It typically forms after a prolonged uptrend as the market starts losing momentum. When the 50-day moving average declines below the 200-day moving average, it reflects a shift in market sentiment from bullish to bearish.
This crossover indicates that recent price movements have been weaker than the longer-term trend, suggesting a potential sell-off. The significance of the death cross increases when it appears on higher timeframes, such as daily or weekly charts, as it indicates a more sustained downtrend.
The death cross is widely used in stock markets but can also be applied to forex and commodities.
How to Identify a Death Cross

Identifying a death cross requires monitoring the relationship between the short-term and long-term moving averages. Here’s how traders spot the pattern:
1) Observe the 50-Day and 200-Day Moving Averages
The first step is to track both the 50-day and 200-day moving averages. When the 50-day moving average starts declining while the 200-day remains flat or trends lower, it suggests weakening market conditions.
2) Watch for the Crossover
The death cross is confirmed when the 50-day moving average crosses below the 200-day moving average. This crossover suggests that short-term price movements are no longer strong enough to sustain the previous uptrend.
3) Analyse Volume and Market Conditions
A death cross with increased trading volume may indicate stronger bearish momentum. If volume spikes as the crossover happens, it confirms that market participants are reacting to the signal.
4) Use Additional Technical Indicators
To increase the accuracy of the death cross, traders often use other indicators like the Relative Strength Index (RSI), Moving Average Convergence Divergence (MACD), and trendlines. If these indicators confirm the legitimacy, the death cross becomes a more reliable signal.
How to Trade the Death Cross
1) Short Selling and Bearish Trades
The most common approach to trading a death cross is short selling, which involves selling an asset with the expectation of rebuying it at a lower price. Traders may enter short positions once the 50-day moving average crosses below the 200-day moving average, especially if it is accompanied by high selling volume.
Traders can also place stop-loss orders above recent highs to limit potential losses when the trend reverses unexpectedly.
2) Using Options to Hedge Risks
Options traders may use put options to profit from declining prices. Buying put options allows traders to benefit from a downtrend while limiting their losses to the premium paid for the options contract.
Another strategy involves using a protective put, where investors who hold long positions buy put options to hedge against potential losses if the market declines.
3) Waiting for a Confirmation Signal
Not all death crosses lead to significant downtrends, so many traders wait for confirmation before executing trades. Confirmation signals can include:
A break below key support levels
Increased selling volume after the crossover
bearish divergence on indicators like RSI or MACD
Waiting for confirmation helps avoid false signals, where the price briefly drops but then quickly rebounds.
4) Trading the Reversal Opportunity
While the death cross is considered a bearish pattern, it sometimes creates opportunities for long-term investors. If the price stabilises after the crossover and begins forming higher lows, traders may look for a reversal trade.
Investors who believe in the asset’s long-term potential may view it as a buying opportunity, especially if fundamentals remain strong. However, this approach requires patience and the ability to withstand potential further declines before a recovery begins.
False Signals and Limitations
While the death cross is a widely recognised bearish signal, it is not foolproof. False signals occur when the short-term moving average briefly crosses below the long-term moving average but reverses direction. These whipsaws can trap traders in losing positions if they enter trades too early.
One limitation of the death cross is that it is a lagging indicator. Since moving averages are based on past price data, the signal often appears after a significant portion of the downtrend has already occurred. This delay can result in traders entering positions late or missing the initial move.
Market conditions also affect the reliability of the signal. In highly volatile markets, short-term price fluctuations can cause frequent crossovers without leading to a sustained trend. Traders should be cautious when using the death cross in choppy or sideways markets.
To reduce the risk of false signals, traders should wait for confirmation from other indicators and market trends. Combining the death cross with volume analysis, RSI, and MACD increases the accuracy of trading decisions.
Conclusion
Considering everything, the death cross is a powerful technical signal that warns traders of potential downtrends. While historically associated with massive market downturns, it is not a guaranteed predictor of crashes.
To trade the death cross successfully, traders should combine it with other technical tools such as RSI, MACD, and volume analysis to prevent false signals, especially in volatile markets.
Disclaimer: This material is for general information purposes only and is not intended as (and should not be considered to be) financial, investment or other advice on which reliance should be placed. No opinion given in the material constitutes a recommendation by EBC or the author that any particular investment, security, transaction or investment strategy is suitable for any specific person.


