Day trading requires precision, speed, and making informed decisions based on technical indicators. Thus, using the right indicators helps traders identify trends, reversals, momentum shifts, and entry or exit points.
This listicle explores ten of the best indicators for day trading, offering high accuracy and reliability. Each indicator plays a unique role in helping traders analyse trends, identify momentum shifts, and optimise their strategies.
Ranking the 10 Best Indicators for Day Trading

1) Moving Averages
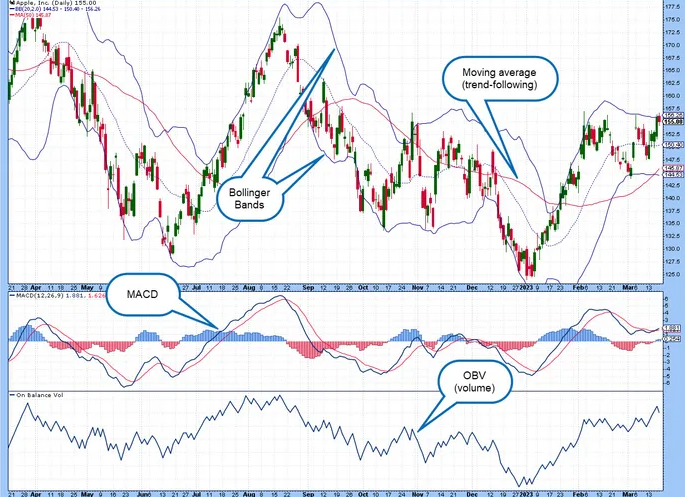
Moving averages are among the most widely used indicators in day trading. They help traders smooth out price fluctuations and identify the overall trend direction. The two most common types are the Simple Moving Average (SMA) and the Exponential Moving Average (EMA).
The SMA calculates the average closing price over a specific period, while the EMA gives more weight to recent price data, making it more responsive to changes. Day traders often use a combination of short-term and long-term moving averages to spot trend reversals and confirm trade entries.
2) Relative Strength Index (RSI)
The Relative Strength Index (RSI) is a momentum indicator that helps traders identify overbought and oversold conditions. It ranges from 0 to 100, with values above 70 indicating overbought conditions and below 30 suggesting oversold conditions.
RSI is particularly useful in volatile markets where price swings are common. When the RSI rises above 30 from an oversold level, it may signal a potential buying opportunity. Conversely, when it drops below 70 from an overbought level, it could indicate a selling opportunity.
3) Moving Average Convergence Divergence (MACD)
MACD is a powerful trend-following indicator that combines moving averages with momentum analysis. It consists of the MACD line, the signal line, and a histogram representing the difference between the two.
When the MACD line crosses above the signal line, it generates a bullish signal, suggesting upward momentum. When it crosses below the signal line, it indicates bearish momentum. The histogram helps traders gauge the strength of a trend, allowing them to time their entries and exits more effectively.
4) Bollinger Bands
Bollinger Bands consist of a middle band (SMA) and two outer bands representing standard deviations from the moving average. These bands expand and contract based on market volatility.
When the price approaches the upper band, it indicates overbought conditions, while movement toward the lower band suggests oversold conditions. Day traders use Bollinger Bands to identify breakouts and reversals, helping them capitalise on short-term price movements.
5) Stochastic Oscillator
The Stochastic Oscillator is another momentum indicator that compares a security's closing price to its price range over a specific period. Like RSI, it ranges from 0 to 100, with levels above 80 indicating overbought conditions and below 20 suggesting oversold conditions.
Day traders use the Stochastic Oscillator to confirm trend reversals and spot divergence between price and momentum, which can signal potential market turning points.
6) Volume Weighted Average Price (VWAP)
VWAP is one of the best indicators for day trading for those who want to follow institutional trading patterns. It calculates the average price of an asset based on both volume and price data.
Traders use VWAP to assess whether the current price is above or below the fair market value. If the price is above VWAP, it suggests bullish momentum, while a price below VWAP indicates bearish sentiment. Many traders use VWAP as a dynamic support and resistance level to optimise trade entries.
7) Fibonacci Retracement
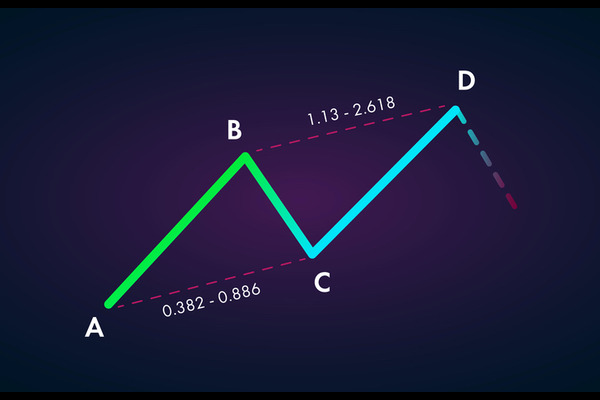
Fibonacci Retracement is a technical tool that helps traders identify potential support and resistance levels based on key Fibonacci ratios (23.6%, 38.2%, 50%, 61.8%, and 78.6%). These levels often coincide with natural price corrections before a trend resumes.
Day traders use Fibonacci retracement to determine ideal entry points during pullbacks and to set profit targets. It is particularly effective when combined with other indicators like moving averages and RSI.
8) Average True Range (ATR)
ATR is a volatility indicator that measures the average price movement of an asset over a specific period. Higher ATR values indicate higher volatility, while lower values suggest a stable market.
Day traders use ATR to set stop-loss levels, ensuring they account for market fluctuations. A widening ATR suggests increased volatility, which can help traders adjust their risk management strategies accordingly.
9) Ichimoku Cloud
The Ichimoku Cloud is a multi-component indicator that provides detailed trend information. It has five lines: the Tenkan-sen, Kijun-sen, Senkou Span A, Senkou Span B, and the Chikou Span.
When the price is above the cloud, it signals a bullish trend, while a price below the cloud indicates a bearish trend. The cloud itself acts as dynamic support and resistance. Ichimoku Cloud is a versatile indicator that provides insight into trend direction, momentum, and potential reversal points.
10) Parabolic SAR
The Parabolic Stop and Reverse (SAR) is an indicator designed to help traders identify trend direction and potential reversal points. It appears as dots above or below the price chart.
When the dots are below the price, it suggests an uptrend. When they are above, it suggests a downtrend. Parabolic SAR is especially useful for day traders looking for precise exit signals in trending markets.
How to Use These Indicators Effectively
Day traders should avoid relying on a single indicator and instead use a combination of indicators to confirm trade signals. For instance, combining a trend-following indicator like the moving average with a momentum indicator like RSI can provide more accurate entry points.
Risk management is also essential when using indicators. Setting stop-loss orders based on ATR or VWAP can help limit losses in volatile markets. Additionally, traders should avoid overcomplicating their strategy with too many indicators, which can lead to conflicting signals and indecision.
Another crucial aspect is backtesting and practice. Traders should test their indicator-based strategies on historical data and use demo accounts to refine their skills before trading with real capital.
Conclusion
In conclusion, using technical indicators effectively can significantly improve a day trader's ability to make informed decisions in the fast-paced world of day trading. The ten indicators covered in this guide offer valuable insights into trends, momentum, volatility, and key support/resistance levels.
However, using high-accuracy indicators does not eliminate the need for risk management. Proper risk-reward ratios, stop-loss placement, and disciplined execution are essential for long-term success. Traders should avoid over-reliance on any single indicator and remain adaptable to changing market conditions. Backtesting strategies using historical data can also help refine entry and exit points.
Disclaimer: This material is for general information purposes only and is not intended as (and should not be considered to be) financial, investment or other advice on which reliance should be placed. No opinion given in the material constitutes a recommendation by EBC or the author that any particular investment, security, transaction or investment strategy is suitable for any specific person.


