The current ratio is a fast way to gauge whether a company can cover its bills over the next 12 months. Investors use it to screen for short-term solvency, compare liquidity across peers, and spot trend changes quarter to quarter. A number above 1.0 generally means current assets exceed current liabilities; below 1.0 can flag pressure that deserves a closer look. As with any ratio, context matters, business model, seasonality, and asset quality can change the story behind the number.
How Do You Calculate the Current Ratio?
At its core, the current ratio is a measure of a company's ability to pay off its short-term obligations (i.e., debts or liabilities) with its short-term assets (i.e., assets that are expected to be converted into cash or consumed within a year). In essence, it answers the question: "Does this company have enough short-term assets to cover its short-term debts?"
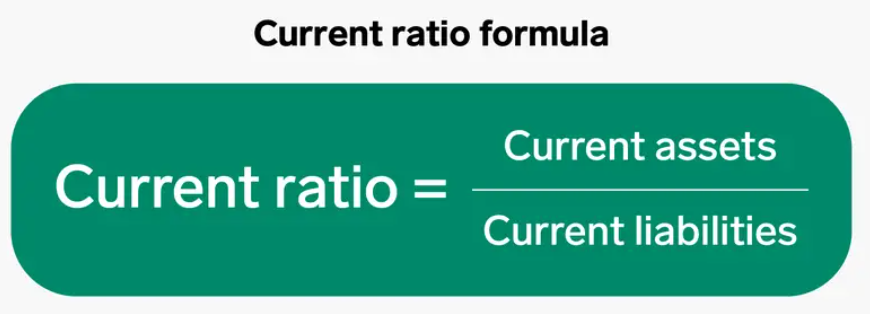
The formula for the current ratio is:
Current Ratio=Current Assets/Current Liabilities
Analyst notes:
Track the ratio over time and vs. industry medians, one datapoint is only a snapshot.
Pair with quick ratio or cash ratio to adjust for inventory or low-quality receivables.
Where:
Current assets include cash, accounts receivable, inventory, and other assets that are expected to be liquidated within the next 12 months.
Current liabilities are debts that must be paid within the same period, including accounts payable, short-term debt, and accrued expenses.
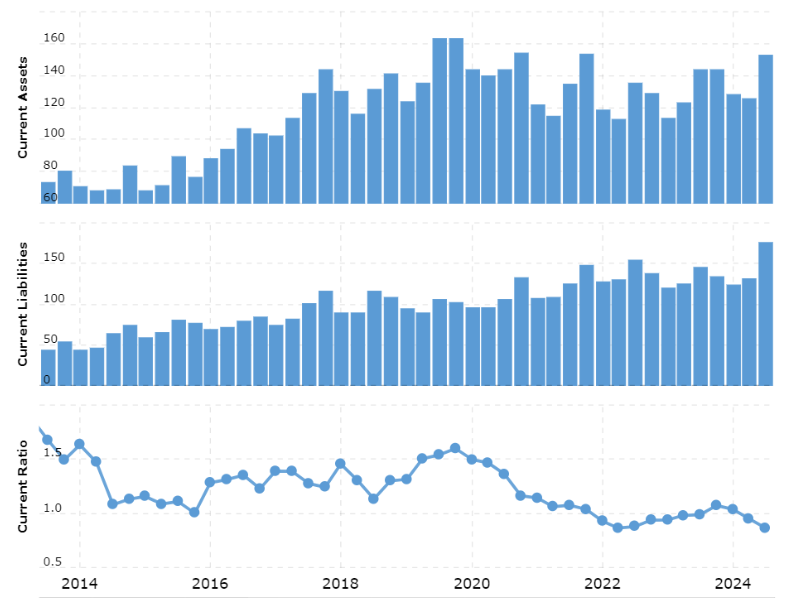
Example: Apple (FY2024)
Current assets $152.987B and current liabilities $176.392B (Apple FY2024 10-K) imply a current ratio ≈ 0.87. A sub-1.0 ratio can signal tighter liquidity, but for cash-generative mega-caps it often reflects efficient working-capital management rather than distress. Always evaluate alongside cash flow and access to funding.
What Counts as a 'Good' Current Ratio?
Many analysts view ~1.5–3.0 as a reasonable range, but “good” depends on the industry and business model. Use peers and history as your yardstick, excessively high ratios can also mean idle capital.
The ratio within this range suggests that the company has sufficient short-term assets to cover its immediate obligations, while still maintaining a healthy balance between liquidity and asset utilisation.
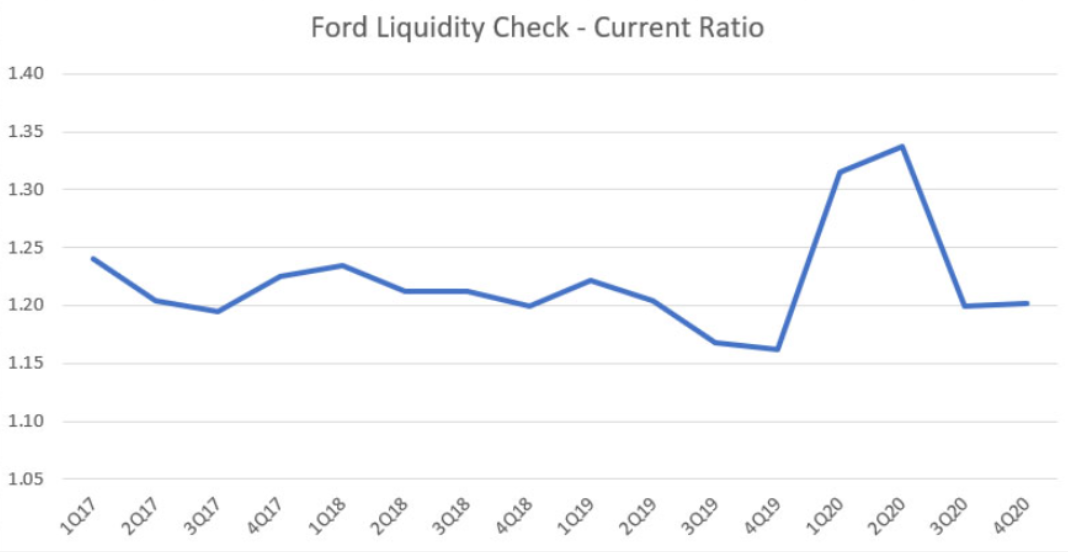
However, it's important to note that what constitutes a "good" current ratio can differ across industries. For instance, companies in capital-intensive sectors like manufacturing or automotive typically operate with lower ratios, as they often rely on long-term financing and have higher levels of inventory.
Ford: current ratio typically ~1.16–1.20 in recent years, adequate for a capital-intensive, inventory-heavy model. This is common in the automotive industry, where high inventory and long production cycles mean companies rely on other forms of financing, like debt or longer-term credit, rather than holding high levels of Liquid Assets.
Conversely, service-oriented businesses with minimal physical assets may tend to have higher ratios due to fewer long-term obligations. Microsoft: current ratio ~1.3 - 1.4 (FY2025 MRQ), consistent with strong liquidity without excessive idle assets. As a software company, Microsoft has low inventory costs and fewer short-term liabilities, allowing it to maintain a stronger liquidity cushion without the need for significant long-term debt.
A ratio significantly above 3 could indicate that the company is hoarding too much cash or other liquid assets, rather than using them for reinvestment or growth opportunities.
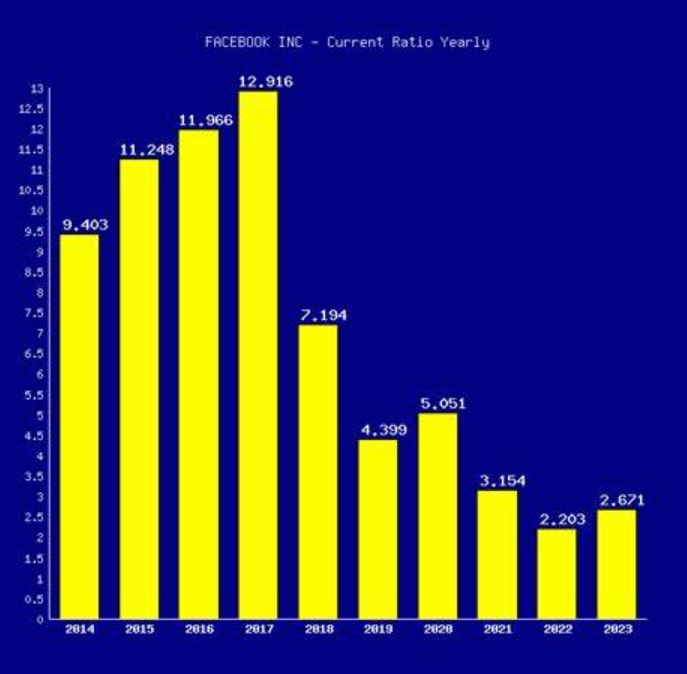
Meta (Facebook): current ratio peaked ~12.92 in 2017, driven by very large cash and marketable-securities balances. A high ratio isn’t automatically “good” or “bad” interpret in context of capital allocation and growth plans
From a lender's perspective, a very high current ratio might signal risk, suggesting the company may not be effectively deploying its cash to generate returns or that it's too conservative with its financial management. Lenders may question why the company has so much cash on hand rather than using it for growth initiatives, which could be seen as a sign of stagnation.
On the other hand, a ratio lower than 1 suggests that the company might struggle to meet its short-term debts, which could signal financial distress if not carefully managed.
J.C. Penney, a well-known American department store chain, which, at its peak, operated hundreds of stores across the United States.
J.C. Penney: liquidity deteriorated ahead of its 2020 bankruptcy, with current ratio hovering around or below 1.0 and persistent operational stress, illustrating how sub-1.0 liquidity can amplify risk.
This meant that the company had insufficient liquid assets to cover its short-term liabilities, and it faced difficulties in fulfilling its immediate obligations.
In such cases, a low current ratio could be an early indicator of liquidity problems, signalling the need for a closer look at the company's financial health and possibly external support or restructuring.
In summary, a "good" current ratio varies by industry and the specific circumstances of a company, but generally, a ratio between 1.5 and 3 is considered healthy. This range typically indicates that a company has sufficient short-term assets to cover its current liabilities, providing a cushion against financial instability. However, context is key; companies in capital-intensive sectors like manufacturing or automotive might operate effectively with lower ratios, while service-oriented businesses could maintain higher ratios without difficulty.
Where Does the Current Ratio Fall Short?
Inventory & receivables quality: the ratio assumes convertibility, slow-moving stock or weak AR collections can overstate liquidity.
Seasonality & timing: quarter-end working-capital swings can inflate/deflate the metric (“window dressing”).
No cash-flow view: use operating cash flow and quick/cash ratios for a fuller picture.
Current Ratio vs. Working Capital
While the current ratio offers a snapshot of liquidity, another important metric for assessing financial health is working capital. Working capital is the absolute dollar amount of resources available to finance a company's day-to-day operations and meet short-term liabilities.
The formula for working capital is:
Working Capital=Current Assets−Current Liabilities
Worked Example (Step by Step)
Balance-sheet snapshot: Current assets = $55,000; Current liabilities = $45,000.
• Working capital = $55,000 − $45,000 = $10,000.
• Current ratio = $55,000 ÷ $45,000 ≈ 1.22.
Interpretation: The firm has a modest liquidity buffer (>$1 in current assets for each $1 of current liabilities). Track this over time and vs. peers for signal, and cross-check with the quick ratio if inventory quality is uncertain.
Where Does the Current Ratio Fall Short?
Inventory & Receivables Quality: The current ratio assumes all current assets are liquid. Slow-moving inventory or weak accounts receivable can overstate true liquidity.
Seasonality & Timing Effects: Companies might “window dress” their ratio at quarter-end. A high number could reflect one-time shifts, not sustainable liquidity.
No Cash-Flow Insight: The ratio measures balance sheet strength, not whether a business generates cash. Use operating cash flow, quick ratio, or cash ratio in tandem for a fuller view.
While both current ratio and working capital are derived from similar balance sheet figures, their application and the insights they offer to investors differ significantly.
Current Ratio is primarily used by investors to assess a company's short-term liquidity and its ability to meet immediate financial obligations. It's especially useful when an investor wants to quickly understand whether the company can cover its current liabilities with its current assets.
As is analysed above, a current ratio greater than 1 generally indicates that the company is in a strong position to handle its short-term debts, whereas a ratio below 1 could signal potential liquidity problems. For instance, if an investor is considering the risk of a company's solvency in the short term or its ability to avoid default, this ratio provides a clear and immediate picture.
On the other hand, working capital is a broader indicator, often more relevant for long-term investors who are interested in a company's overall financial health and stability. It represents the difference between a company's current assets and current liabilities, providing a snapshot of how much capital is available to fund its daily operations and cover short-term debts.
For investors focused on the company's operational efficiency and long-term growth potential, working capital is a useful metric. It reflects whether the company has enough resources to fund its day-to-day activities without the need to rely on external financing.
While the current ratio gives an investor a quick, quantitative snapshot of a company's liquidity, working capital gives a more comprehensive view of the company's operational financial health. In practice, investors might use the ratio to quickly gauge a company's liquidity position, especially when assessing risk or considering short-term investment strategies. Working capital, however, is more beneficial when investors are looking at a company's ability to sustain growth and manage its operations efficiently over time.
In summary, the current ratio is ideal for assessing short-term financial stability, while working capital provides deeper insights into a company's operational efficiency and its capacity to meet both short-term and long-term financial goals.
Current Ratio vs. Working Capital: What’s the Difference?
| Aspect |
Current Ratio |
Working Capital |
| Definition |
Current Assets ÷ Current Liabilities |
Current Assets − Current Liabilities |
| What it shows |
Liquidity multiple (coverage) |
Dollar buffer (funds available) |
| Best for |
Quick comparison across peers/time
|
Assessing operational runway
|
| Watch-outs |
Asset quality, seasonality |
Doesn’t scale by company size |
FAQs
What is a good current ratio for most companies?
There’s no one-size-fits-all number, but many analysts view ~1.5–3.0 as reasonable, adjusted for industry and business model.
Is a current ratio below 1.0 always bad?
No. It can flag tighter liquidity, but cash-rich, high-turn businesses may operate efficiently below 1.0. Always check cash flow and funding access.
Why compare current ratio with the quick ratio?
The quick ratio removes inventory and some other items for a more conservative test of near-cash coverage.
How should investors use current ratio in screening?
Track it over multiple periods, compare with peer medians, and pair with operating cash flow, debt maturity profile, and credit access for context.
Can a very high current ratio be a red flag?
Sometimes. It may indicate idle capital or conservative deployment; check capital-allocation plans and returns on cash.
Disclaimer: This material is for general information purposes only and is not intended as (and should not be considered to be) financial, investment or other advice on which reliance should be placed. No opinion given in the material constitutes a recommendation by EBC or the author that any particular investment, security, transaction or investment strategy is suitable for any specific person.
