As an investor, one of the key indicators you look at when assessing a company's financial health is its ability to meet short-term obligations. The quick ratio is a powerful tool that helps you do just that. Unlike other financial metrics that include all current assets, this ratio zooms in on a company's most liquid assets—those that can be quickly converted into cash. This makes it an invaluable gauge of how well a company can weather a financial storm without relying on inventory.
Quick Ratio's Definition and Calculation
The quick ratio, often referred to as the acid-test ratio, is a measure of a company's short-term liquidity, specifically its ability to pay off its current liabilities without needing to sell inventory. This ratio is a stricter version of the current ratio, as it excludes inventory from the calculation, assuming that inventory might not be as easily converted into cash in the short term. This ratio is particularly useful for businesses with a significant amount of stock that may be hard to liquidate quickly.
The formula for the ratio is as follows:
Quick Ratio= (Current Assets – Inventory)/Current Liabilities
In this formula, current assets represent assets that are expected to be converted into cash within one year, while inventory is excluded because it is often less liquid than other current assets. Current liabilities are the obligations that the company must settle within the next 12 months.

By focusing on assets that are easily convertible to cash, like cash itself, receivables, and marketable securities, this ratio provides a more conservative measure of liquidity. Unlike other financial ratios that may rely on the assumption that inventory can quickly be sold, the quick ratio offers a more stringent perspective, especially important in industries where stock turnover is slow or unpredictable.
What is a Good Quick Ratio?
A good quick ratio generally falls around 1.0 or higher, as it indicates that a company can cover its short-term liabilities with its most liquid assets, such as cash, accounts receivable, and marketable securities. A ratio of 1.0 means the company has just enough liquid assets to meet its current obligations without having to rely on selling inventory. However, this threshold is not a one-size-fits-all benchmark and can vary depending on the industry, business model, and specific circumstances of the company.
On the other hand, a quick ratio below 1.0 can be a cause for concern, as it indicates that a company might struggle to meet its short-term obligations without having to liquidate inventory or secure additional financing.
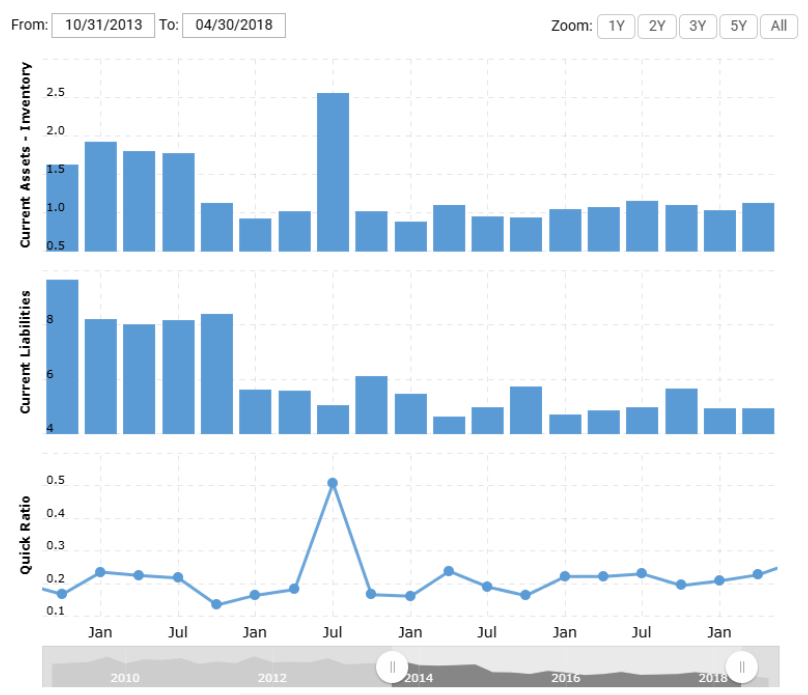
For instance, Sears, once a retail giant in the US, had a quick ratio well below 1 in its final years before filing for bankruptcy. The company's declining sales, heavy debt burden, and large inventory piles led to liquidity issues, making it increasingly difficult to meet short-term obligations. Despite its large assets, Sears was unable to convert them into cash quickly enough to sustain operations.
Is a Higher Quick Ratio Better?
Generally, a higher quick ratio is considered more favourable, as it indicates that a company has more liquid assets available compared to its short-term liabilities. A higher ratio suggests that the company can quickly convert assets into cash if needed in an emergency.
However, it's important to note that an excessively high quick ratio may not always be advantageous. For instance, a company with a substantial cash reserve might be holding capital that could be better utilised for growth or investment in new opportunities. Striking the right balance between ensuring liquidity for short-term needs and investing in long-term potential is often a delicate task.
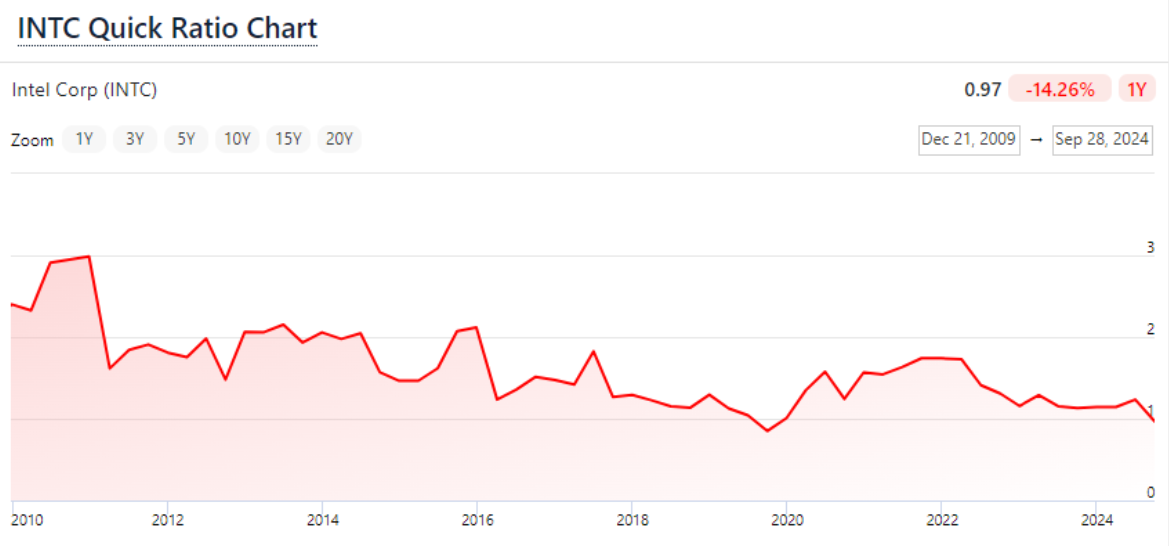
Intel, one of the largest semiconductor companies, had a high quick ratio in the early 2010s due to its strong cash position. However, despite its large cash reserves, the company faced criticism for not investing aggressively enough in emerging technologies, such as mobile processors, which allowed competitors like ARM and Qualcomm to gain market share. While Intel's financial position seemed secure, its slow response to changes in the tech landscape hindered its ability to sustain growth, and the company was overtaken by competitors in the mobile processor market.
Industry-Specific Considerations
The acceptable quick ratio varies by industry, as certain sectors have different capital structures, liquidity needs, and inventory turnover rates. For instance, companies in the technology sector, such as Apple or Microsoft, typically have high ratios. These businesses often generate cash through services or intellectual property, with low reliance on inventory. Therefore, having a ratio above 1.0 — even significantly higher — is less concerning, as these companies are unlikely to face liquidity problems.
In contrast, companies in retail or manufacturing industries, like Home Depot or Ford, might naturally have a lower ratio. These businesses often carry large inventories as part of their regular operations, and while their current ratios might be higher due to inventory, their quick ratios will tend to be lower. This doesn't necessarily indicate poor financial health, but it does suggest a reliance on inventory to meet obligations.
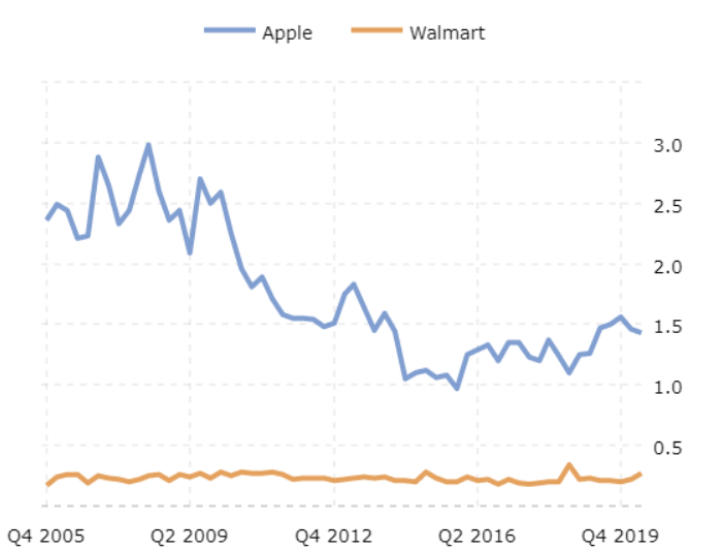
For example, as is shown in that chart below, Apple Inc. (AAPL), a company known for its massive cash reserves, has a high quick ratio because it holds significant amounts of cash and accounts receivable, which are quickly convertible into cash. In contrast, a company in the retail sector, like Walmart, might find its ratio somewhat lower because a large portion of its current assets are tied up in inventory.
To sum up, the key to interpreting this ratio effectively lies in understanding the balance between liquidity and operational efficiency. A ratio that is too high could indicate underutilised assets, while a ratio that is too low suggests potential liquidity issues. Ideally, a company should maintain a quick ratio that ensures it has enough liquidity to meet its obligations but also uses its assets efficiently to drive growth.
Quick Ratio vs Current Ratio
The quick ratio is often compared to the current ratio, another key liquidity measure, which includes inventory in the calculation. While both ratios provide valuable insight into a company's liquidity, they serve different purposes and highlight different aspects of financial health.
The current ratio is calculated as follows:
Current Ratio=Current Asset/Current Liabilities
The key difference between the two ratios lies in how they treat inventory. The current ratio includes all current assets, including inventory, while the quick ratio excludes inventory, focusing solely on assets that can quickly be converted into cash.
Take Amazon as an example. Its current ratio might be higher than its quick ratio because it holds large quantities of inventory, which can be converted into cash but might not be as liquid as cash or receivables.
A high current ratio might suggest that Amazon has a lot of short-term assets, but a lower quick ratio would reflect that much of that asset base is tied up in inventory.
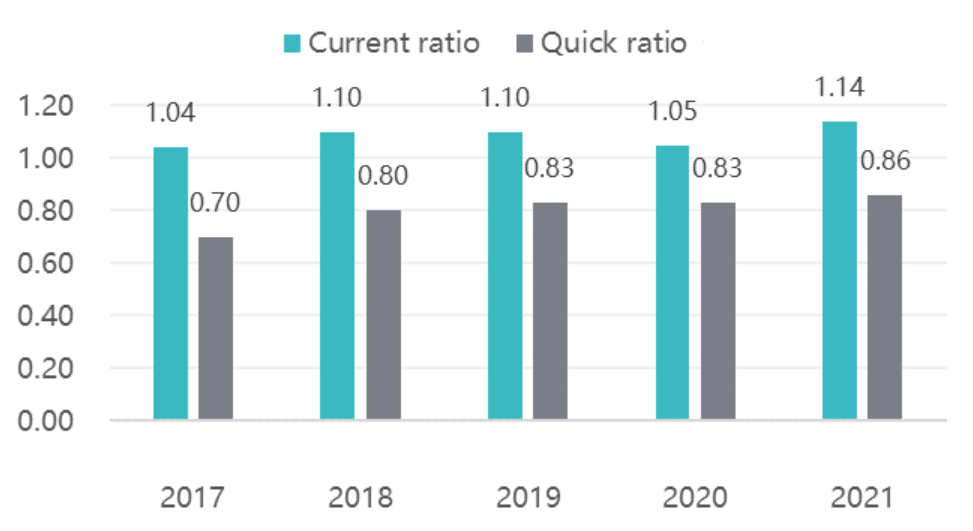
In contrast, a company with a high quick ratio but a lower current ratio may indicate that its liquidity is derived more from cash and receivables than from inventory.
Google (Alphabet), for example, tends to have a much higher quick ratio compared to its current ratio, as it holds substantial cash reserves and low inventory levels due to its nature as a tech company.
While both ratios are important, the quick ratio provides a more conservative, immediate view of a company's ability to pay its debts in the short term, excluding the potential uncertainty of inventory turnover. On the other hand, the current ratio can give a broader, less stringent picture, but it may overstate liquidity if inventory is slow-moving or difficult to convert into cash.
In conclusion, the quick ratio is a powerful financial tool that offers a clear snapshot of a company's short-term liquidity, focusing on its most liquid assets. A ratio above 1.0 generally suggests that a company can cover its current liabilities with its most easily liquidated assets, while a ratio below 1.0 may signal liquidity concerns. By excluding inventory from the equation, this ratio provides a more stringent measure of financial health than the current ratio, which can be more lenient due to its inclusion of inventory.
Disclaimer: This material is for general information purposes only and is not intended as (and should not be considered to be) financial, investment or other advice on which reliance should be placed. No opinion given in the material constitutes a recommendation by EBC or the author that any particular investment, security, transaction or investment strategy is suitable for any specific person.


