Warren Buffett, the god of the stock market, once said that I am fearful when others are greedy, and I am greedy when others are fearful. This is what the Fear and Greed Index represents. And in the investment world, if you know how to use the fear and greed index, then you will find that this statement is indeed true.
The Fear and Greed Index can be used as a reference factor when analyzing the market. Because the financial market is very volatile and full of emotions, When the market rises, people tend to become greedy, and the greed index of the market tends to be severe. On the contrary, if the market price is in a state of decline, then investors will experience panic.
With the fear and greed indices, it is actually possible to make some simple judgments. The first is that when in a state of extreme fear, it could be a sign that investors are too worried, and this is an excellent signal to buy. When the market is extremely greedy, it means that the market should recalibrate, and this can be seen as a sell signal.
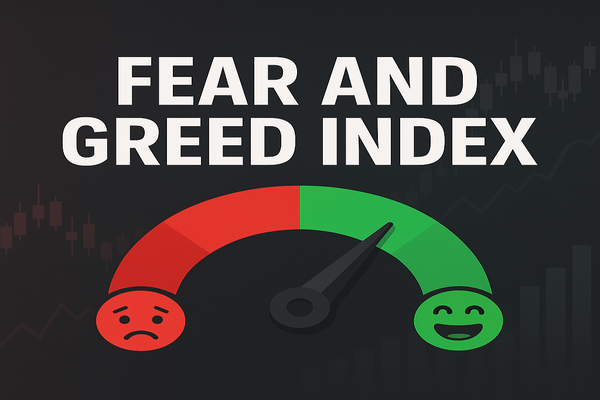
The Fear and Greed Index, or FGI for short, is an indicator used to measure investor sentiment and emotion in financial markets. This indicator is commonly used in the stock market, especially the U.S. stock market, to help investors better understand the sentiment of market participants and the short-term movement of the market.
It typically uses a range of 0 to 100. where different values represent different market sentiments. In general, lower values (usually below 20) indicate that market investors are more fearful and cautious and may be bearish on the market. Higher values (usually above 80) indicate that market investors are more greedy and may be bullish on the market. Values in the middle range indicate relatively balanced market sentiment.
What is the Fear and Greed Index
| Index |
Implications |
Explanation |
| Fear Index |
Measuring Market Fear |
Investors are worried and upset about the market. |
| Greed Index |
Measuring Market Greed |
Investors are optimistic and greedy about the market. |
Fear and Greed Index Formula Calculation
Its formula varies from market to market, depending on the asset or market being followed. It is a customized index based on a weighted average of several market sentiment indicators. Generally, it has six dimensions, which in the case of the CNN Fear and Greed Index include:
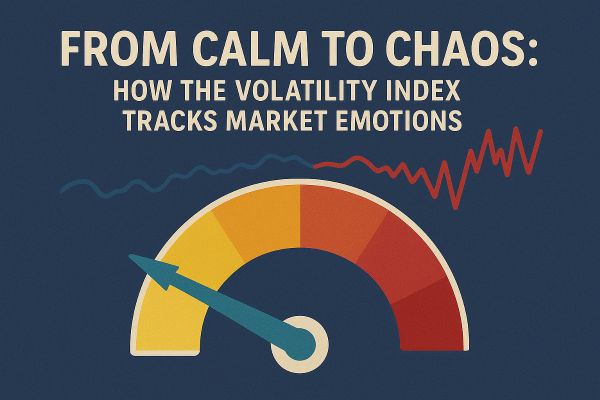
Market volatility: It accounts for about 25% of the total calculation dimension.Because market sentiment is related to the volatility of a stock, a comparison is made based on the average price over the last 30 days and 90 days. Due to an abnormal rise in volatility, it affects the entire market and presents a state of panic.
Trading Volume: Large-scale trading activity may reflect the sentiment of the market, and hence trading volume may be included as a factor in the index calculation. Again, it is 25% of the total. Again, a comparison is made based on the average of the last 30 days and 90 days of volume. Generally, when the market is buying heavily, it is showing greed.
News Coverage: news coverage and media influence on the market may also be considered, both negative and positive. The percentage is 15%. Title tags and keywords of articles are counted by analyzing social media such as twitter and Reddit. This is what we usually call the media effect. Because media articles can have a big impact on the market, The activity and interaction rate can affect the public's enthusiasm for buying and selling stocks, putting the market in a greedy direction.
Market research and voting: Market research and voting data can provide information on investor perceptions and sentiment towards the market, accounting for 15%.These data can include online poll results, survey data, etc.
Asset Distribution: Observe the distribution of different asset classes, such as stocks, bonds, gold, etc. The percentage is 10%. Asset distribution can reflect the degree of investor diversification, and based on the share of stocks in the overall market, it can analyze the greed and panic of investors. If the share of stocks in the market declines, it means that investors are focusing more on other products. Then the market sentiment is in panic for stocks and in greed for other investment products.
Search Trends: Analyze search trends and keywords in search engines regarding the stock market and stocks. Search trends can reveal the level of investor interest in a particular stock or market.
Fear and Greed Index Search
| resource |
Sample Queries |
| CNN Money |
Post-visit searches provide up-to-date values and explanations of the index. |
| CNBC |
Go to site search to provide current values and interpretation of the index. |
| Investopedia |
Access to site search provides access to interpretations and information. |
| Bloomberg |
Access to site search provides access to the latest values of the index. |
| Investment applications |
E.g. TradingView, Yahoo Finance, etc. can view relevant chart data. |
Fear & Greed Index Historical Trends
The Fear & Greed Index is a relatively new market sentiment index that is typically provided on a daily or weekly basis to reflect the mood and emotions of market investors. Due to its real-time nature, historical trend data can often be found on multiple financial news websites, financial data providers, investment platforms, and apps. This data is often presented in the form of graphs or charts so that investors can better understand the evolution of market sentiment.
Fear and Greed Index and Gold
It's usually associated with the stock market and is used to measure the mood and sentiment of investors in the stock market. This index is not directly related to the gold market. However, investors may sometimes compare or relate this index to other markets, including the gold market.
There may be some potential relationship between it and gold. For example, when the Fear and Greed Index shows that market sentiment is more fearful, investors may seek safe-haven assets such as gold. Gold is often viewed as a hedging asset that may provide value preservation in times of unstable markets.
Or, in some cases, there may be an inverse correlation between the stock market and the gold market. That is, when the stock market is weak, the gold market may be strong, and vice versa. Fear and greed indices can reflect market sentiment, which can affect investor demand for gold.
High-fear sentiment may be related to market uncertainty and risk. Because gold is considered a safe-haven asset, it shows strong demand when market uncertainty is high.
How to interpret the Greed Index and Fear Index
| Index |
High values (usually 80+) |
Medium value |
Low values |
| Greed Index |
Extreme optimism and greed. |
Confident not greedy. |
Cautious, oversold market. |
| Fear Index |
Market panic. |
Relatively balanced emotionally. |
Optimistic, low market risk. |
Disclaimer: This material is for general information purposes only and is not intended as (and should not be considered to be) financial, investment, or other advice on which reliance should be placed. No opinion given in the material constitutes a recommendation by EBC or the author that any particular investment, security, transaction, or investment strategy is suitable for any specific person.
