In life, everyone schedules their activities by looking at the weather forecast when they go out every day. And in the stock market, investors will also choose to check the stock indices before trading. Among them, as one of the indexes measuring the overall performance of China's A-share market, CSI 300 is an important tool for many investors to understand market trends and investment opportunities. Now, let's tell you more about the investment value and long-term strategy of CSI 300.
 What does CSI 300 mean?
It is an important stock index of China's A-share market, which consists of 300 stocks with high Market Capitalization and liquidity on the Shanghai and Shenzhen stock exchanges, aiming to reflect the performance of China's A-share market as a whole. The index covers a wide range of industries and sectors and is widely used to measure market trends, assess portfolio performance, and serve as a benchmark for financial products.
It is a large, liquid, and representative index of 300 companies selected from the Shanghai and Shenzhen markets. Therefore, by purchasing this stock index, investors can realize diversified investments in these 300 representative companies, which can effectively reduce the risk of a single stock and track the performance of the whole market at the same time.
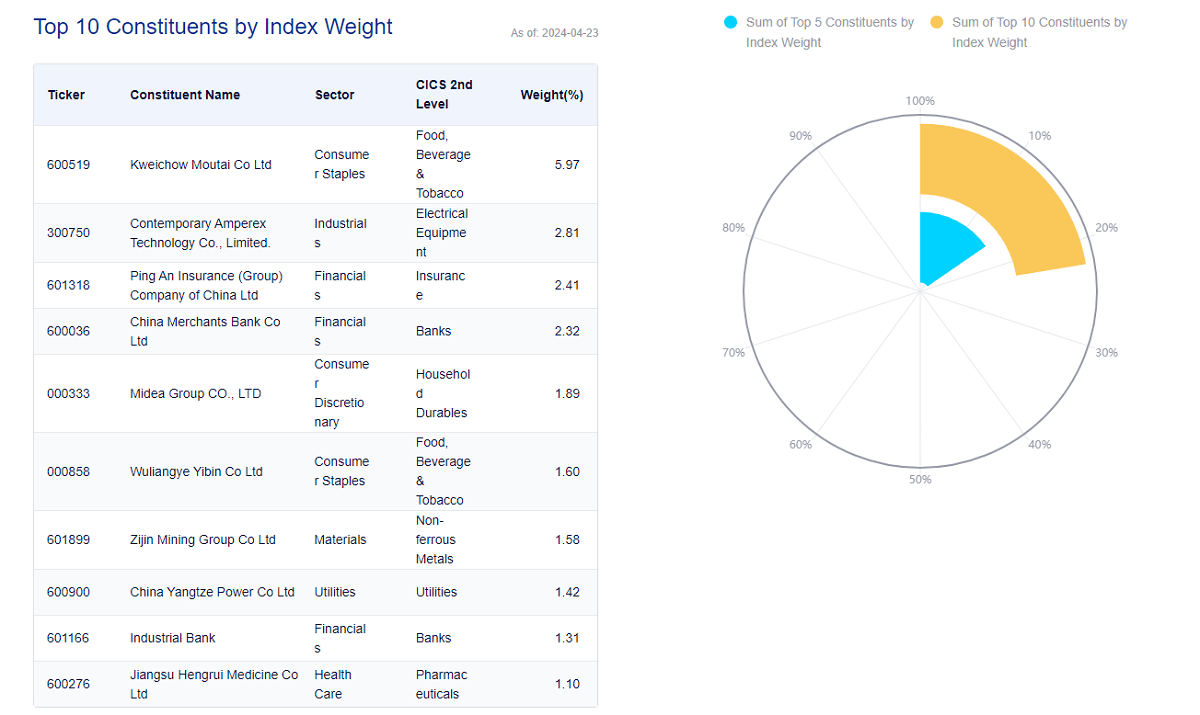
Among the top ten weighted stocks of the CSI 300 index, the financial sector holds three companies, namely Ping An of China, China Merchants Bank, and CITIC Securities, all of which are the head enterprises of the financial sector. In the liquor sector, Guizhou Maotai and Wuliangye are the industry leaders. In addition, Gree Electric Appliances and Midea Group are the leading companies in the household appliances industry, representing high-quality companies in the industry.
In the pharmaceutical and health sector, Hengrui Medicine is the leading company, while the leading company in the technology sector is Lixin Precision. These top ten weighted stocks cover a wide range of industry sectors and are all leading companies in their respective fields, reflecting the diversity and representativeness of the CSI 300 Index.
Moreover, the industry distribution of the index's constituents is relatively balanced, ensuring that the influence of a single industry does not exceed 50%, thus improving the stability of the investment portfolio. Among them, the financial and industrial sectors account for the highest proportion in the index, at 40.78%, reflecting the importance of financial and industrial sectors in China's capital market. In addition, the Major Consumer Goods sector has a weighting of 13.46%, demonstrating the key role of major consumer goods in the daily lives of residents.
The index also covers a wide range of sectors, including information technology, raw materials, consumer discretionary, and medicine and healthcare, which have a weighting of 11.36%, 8.13%, 7.7%, and 6.51%, respectively, enabling the CSI 300 Index to comprehensively reflect the multi-faceted development of China's economy.
In terms of the exchanges to which the constituents belong, 188 of the index's constituents belong to the Shanghai Stock Exchange, and 112 belong to the Shenzhen Stock Exchange. This distribution reflects the representativeness of China's two major exchanges, making the index a more comprehensive reflection of China's stock market as a whole.
At the same time, the index manages its constituents very strictly and usually makes adjustments to its constituents every six months. ST or *ST stocks that have financial conditions, violations, or illegal events or are at risk of delisting will be eliminated, and the highest-ranked stocks from the candidate sample will be selected to represent them.
This strict management approach allows the CSI 300 Index to maintain high standards of performance, liquidity, and other aspects, which helps to reflect the overall market performance in a stable manner over the long term. And because it represents the major sectors and companies in the Chinese market, it is able to offset, to some extent, the volatility of individual companies or sectors.
Through regular adjustments and strict management of constituents, the index is able to maintain its long-term stability and representativeness, as well as its sustainability. The permanence and representativeness of the index enable it to gain widespread trust among investors and the market and provide high value for long-term investment. Meanwhile, as a traditional large-cap blue-chip index, its constituents usually have stable performance and low risk, thus providing high long-term investment value.
All in all, the CSI 300 Index comprehensively reflects the overall trend of China's A-share market and is an important reference for investors to measure the market trend. Moreover, due to the high quality of its constituents and the regular adjustment mechanism, the index is also characterized by both stability and growth, making it suitable for long-term investment.
 CSI 300 P/E Ratio and Yield
The P/E ratio reflects the valuation level of a stock or index, with lower P/E ratios usually implying a higher relative value of an investment. Yield, on the other hand, shows the actual return of an investment, with a higher yield implying a higher return on investment. They are important indicators for evaluating the value of an investment. By analyzing the P/E ratio and the yield, investors can better gauge the investment potential of the CSI 300 Index.
The price-earnings ratio (PE ratio) is calculated by dividing the total market capitalization of the index by the total net profit of the constituents, which can measure the overall valuation level of the constituents in the index. Higher P/E ratios may indicate that the market's expectation of future earnings of the constituents is high, but there may also be the risk of overvaluation; lower P/E ratios may indicate that the market's expectation of future earnings of the constituents is low or the stock price is undervalued.
The CSI 300 price-earnings ratio is usually maintained between 10 and 15 times, in a relatively reasonable valuation range. This reflects its large-cap blue-chip nature, which is much more stable than the GEM index's price-to-earnings ratio of 30 to 60 times. Such stability provides investors with the opportunity to invest at a relatively reasonable price range in pursuit of long-term, stable returns.
Yield measures the performance of an index over a specific time period and can be used to gauge market trends and determine investment performance. It is derived by calculating the change in the index over a period of time and can be expressed as a percentage. First, determine the time period over which the rate of return is to be calculated, e.g., a year, a quarter, a month, etc.
Then calculate the rate of return according to the formula: Rate of return = (index value at the end minus index value at the beginning) ÷ index value at the beginning x 100%. For example, if the index is 3500 points at the beginning and 3800 points at the end, then the rate of return is calculated as follows: (3800-3500)÷3500×100%=(300÷3500)×100%≈8.57
The CSI 300 index return (ROE) has been maintained at around 11%, showing more stable profitability. Of course, since the index contains more than 300 companies, it is not possible for every one of them to meet the 20% ROE standard, but the overall average has been maintained above 11%, which indicates the stability of its profitability. Many high-quality companies, such as Guizhou Moutai, Yili Shares, and Gree Electric, have maintained high earnings stability over time, further reinforcing the overall profitability advantage of the index.
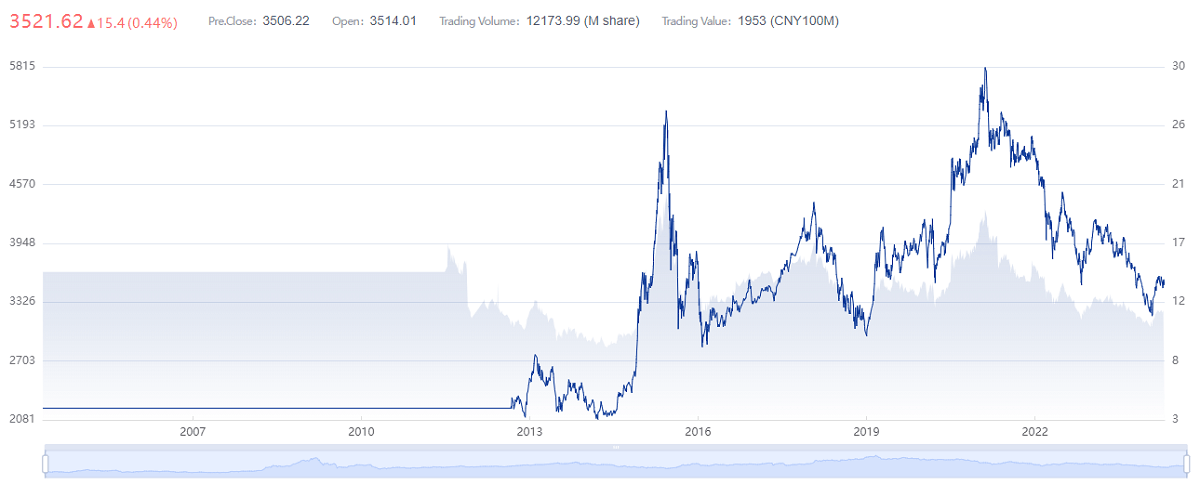
As can be seen from the historical data, the index was released on December 31. 2004 with a starting point of 1.000. and as of July 31. 2020. the index reached 4.695.05 points, representing a total return of 369.5% and an annualized return of approximately 10.4%. These yields are based on a long-term hold without any buying or selling operations. The yields could have been higher if the index was sold when it was relatively overvalued and bought when it was relatively undervalued.
You can also look at its net profit growth rate, which is an important indicator of business growth. A company's ability to maintain profitability and sustained growth over a long period of time implies that it has huge room for growth. The net profit growth rate of the CSI 300 Index has been around 10% for a long time, indicating that the constituents of the index are still maintaining a medium-speed growth trend. The companies included in the index have shown good growth in profitability and potential investment value.
Therefore, from measuring the investment value of the index in terms of its stability, growth, and profitability, it is clear that it is indeed suitable for long-term investment, especially for investors who wish to invest in China's A-share market by investing in the highest quality companies. Holding the CSI 300 Index Fund for a long period of time can help investors reap the benefits of overall market growth and reduce the risk of investing in a single stock.
 CSI 300 Index Fund
The index is composed of 300 stocks that are the largest, most liquid, and most representative of the Shanghai and Shenzhen stock markets, covering a wide range of industries and sectors, which reduces the impact of fluctuations in a single company or industry on investment. So it is an effective way to diversify investment risk by investing in the CSI 300 Index, which represents the overall trend of the A-share market.
Moreover, the index fund usually maintains relatively stable dividends, providing investors with cash flow and stable income. In addition, the constituents of the index will be adjusted every six months by removing underperforming companies and replacing them with new ones that meet the criteria. This dynamic adjustment ensures the continued vitality and quality of the index, providing investors with consistent and stable investment opportunities.
Long-term investment The index fund is bought at market troughs and held for a long period of time to enjoy the potential gains from the overall market rally. By holding for a long period of time, investors can capitalize on the dividends of China's continued economic growth, which can lead to higher investment returns. Moreover, the management fees and transaction costs of such funds are usually lower than those of actively managed funds, which means that more of the returns can be returned to investors, lowering investment costs and improving overall returns.
When investing in this index fund, you can choose an enhanced fund. It tracks the CSI 300 Index and may realize excess returns through active management by the fund manager, such as adjusting positions and stock selection. This management strategy helps to achieve better performance during market volatility and improve investment returns.
Therefore, the management ability of the fund manager is critical to the performance of the fund. Choosing a fund managed by an experienced fund manager with a proven track record may be more conducive to achieving consistent returns. A fund manager's decisions and strategies will have a direct impact on the performance of the fund, so understanding the manager's management experience and historical performance is a key component when choosing a fund.
Moreover, investing in this type of fund requires a certain long-term investment strategy to avoid the risks and expenses associated with frequent buying and selling. Holding these funds for a long period of time can help you better capitalize on the overall rise in the market while reducing the transaction costs associated with frequent trading. In addition, a long-term investment strategy can help you avoid the effects of short-term market fluctuations and achieve more stable investment returns.
Therefore, if you want to get better investment returns, you can refer to the fund in terms of its age of establishment, fund size, tracking error, trading rate, operation rate, and historical performance when screening out the most suitable fund for investment among the many funds tracking the CSI 300 Index.
Try to choose funds that have been in existence for more than three years, as past performance can be used to determine whether the fund's ability to track the index, its ability to withstand risk, and its tracking error are reasonable. A longer inception period provides more data and market experience, which helps to assess the fund's performance in different market environments.
You should also try to choose a larger fund, at least over $200 million in size, to avoid choosing a fund that is too small. A larger fund provides better liquidity, lower transaction costs, and more stable performance during market volatility. This helps to improve investment stability and profitability, allowing investors to better capitalize on market opportunities over the long term.
Tracking error is one of the key indicators of a fund's ability to track an index and is usually expressed by calculating the standard deviation between the fund's return and the return of the benchmark index over a period of time. A lower tracking error means that the fund performs more accurately in tracking the benchmark index, and the fund's performance is closer to the trend of the benchmark index.
Non-enhanced index funds should try to keep the tracking error below 0.2%, preferably less than 0.1%, to ensure that the fund's performance is as close as possible to the performance of the CSI 300 Index. A smaller tracking error means that the fund will track the index more accurately and better reflect the trend of the index, thus reducing investment risk and improving investment returns.
Choosing a fund with a lower operating fee rate is an important consideration for investors, as a lower operating fee rate means lower investment costs. In long-term investments, the impact of a lower operating expense ratio on the investment return will be more significant. Therefore, when selecting index funds, try to choose funds with lower operating expense ratios to ensure higher investment efficiency and returns.
By comparing the screened index funds based on their historical performance, funds that have outperformed the average performance of the index over a long period of time are selected. Better investment opportunities can be identified by comparing the fund's performance over time and against other funds in the same category. Ultimately, such selection will help investors achieve their long-term investment goals and improve their investment returns.
Based on these metrics, investors will be able to screen for the most desirable choices for long-term investment. It is important to note that for long-term holding, one can choose Class A funds, which usually adopt a back-end fee charging mechanism and are suitable for a one-time purchase and holding for more than 2 years. For short-term holding or fixed investment, you can choose a Class C fund, which adopts a front-end fee charging mechanism with higher flexibility and is suitable for investors to flexibly adjust their investment strategy according to the market situation.
Through the CSI 300 Index Fund, investors can conveniently invest in the China A-share market and enjoy the benefits of the overall market performance. Such a choice helps investors realize their long-term investment objectives and enhance their investment returns. However, when investing in the fund, it is important to note that investment involves a certain degree of risk. It is therefore crucial to ensure that you choose a product that meets your investment objectives and risk tolerance.
Which CSI 300 fund is the best?
| Fund Code |
Fund Name (CSI 300) |
Management fee rate (%) |
Tracking error (%) |
Suitable for investors |
| 510300 |
Huatai-Perry CSI ETF |
0.5 |
0.10 |
Long-term |
| 512300 |
Wells Fargo CSI ETF |
0.5 |
0.15 |
Long-term |
| 159919 |
Efonda CSI ETF |
0.5 |
0.10 |
Long-term |
| 110020 |
Efonda CSI Connect A |
1.0 |
0.20 |
Long term |
| 001417 |
BOC CSI Index Fund |
0.75 |
0.18 |
Long term |
| 002910 |
Zhongrong CSI ETF |
0.5 |
0.12 |
Long-term |
| 510360 |
ETF Shanghai & Shenzhen ETF |
0.5 |
0.08 |
Long-term |
| 159915 |
Huatai-Perry CSI ETF |
0.5 |
0.10 |
Long-term |
| 002987 |
Guangfa CSI Connect C |
0.6 |
0.15 |
Short-term |
| 000961 |
Tianhong CSI Connect A |
0.5 |
0.12 |
Short-term |
Disclaimer: This material is for general information purposes only and is not intended as (and should not be considered to be) financial, investment, or other advice on which reliance should be placed. No opinion given in the material constitutes a recommendation by EBC or the author that any particular investment, security, transaction, or investment strategy is suitable for any specific person.


 What does CSI 300 mean?
 CSI 300 P/E Ratio and Yield
 CSI 300 Index Fund


