In the stock market, the period of aggregated bidding is like a tug-of-war. Buyers and sellers are each fighting for their own interests. Their willingness to trade is centralized and aggregated during this time until a mutually agreed-upon opening price is reached. This process is full of market forces and games that ultimately lead stock trading into the normal trading phase. Now let's take a good look at the rules and techniques of the aggregated bidding mechanism.

What is a Call Auction?
It is a trading mechanism in the securities market used to determine the trading price of stocks over a certain period of time (usually the opening and closing hours). Its main feature is to centralize buy and sell orders over a period of time and then summarize the transactions in accordance with certain rules to arrive at a uniform transaction price.
The main purpose of a call auction is to determine the daily opening and closing prices of stocks to ensure the continuity and stability of market trading. At the opening, it is through the collection of buyers and sellers of the commission order to find a suitable transaction price to determine the day's opening price. And at the close, it determines the final trading price by integrating the willingness to buy and sell in the market at that time, which determines the closing price of the stock.
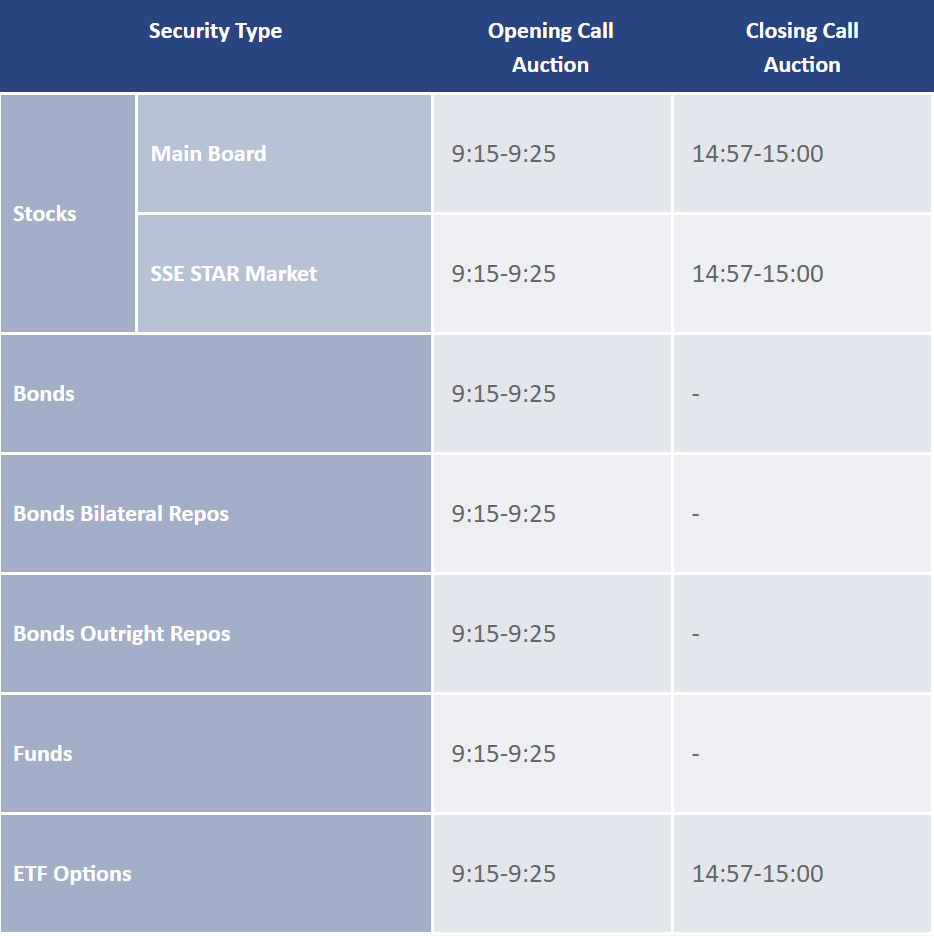
The opening aggregate bid is an important part of the morning of each trading day in the stock market, usually from 9:15 a.m. to 9:25 a.m. During this time, market participants on both the buy and sell side can submit their buy and sell orders in anticipation of a transaction at the most favorable price.
Generally speaking, the period from 9:15 to 9:20 is known as the free bidding period, during which investors are free to submit buy and sell orders or to cancel them at any time, depending on the market conditions. During the period from 9:20 to 9:25. investors are allowed to continue submitting buy and sell orders but are not permitted to cancel their orders during this period. This means that once orders are submitted, investors cannot withdraw them during this period.
And at 9:25. the exchange's trading system aggregates and matches all valid buy and sell orders. Based on the bidding rules, the volume of orders that can be filled at the best price is determined, and this price is used as the opening price for the day. This process ensures that the opening price is fair and efficient and lays the foundation for the normal operation of the market.
Closing Aggregated bidding usually occurs in the last few minutes of each trading day, from 14:57 to 15:00. Its main purpose is to determine the day's closing price by aggregating and matching all valid orders. During this time, investors can submit buy and sell orders, but once submitted, they cannot be canceled.
14:57 to 15:00 provides investors with a final opportunity to participate in the day's trading. During this time, investors can submit buy and sell orders but are not allowed to cancel them. Instead, by 15:00. the exchange's trading system will aggregate and match all valid buy and sell orders. Based on the rules of a call auction, the volume of orders that can be filled at the best price is determined, and this price is used as the closing price for the day.
The determination of the closing price is usually calculated on the basis of all valid orders submitted, especially those submitted in the last few minutes. This mechanism helps to avoid dramatic price fluctuations triggered by a single large order while providing investors with a fair settlement price. In this process, the willingness to buy and sell in the market is centralized within a short period of time, and the resulting closing price can effectively reflect the trading willingness of a wide range of investors and the equilibrium of the market price.
The call auction mechanism ensures price certainty and fairness in the market at the opening and closing of the market. Investors can submit buy and sell orders during this period, and these orders are centrally aggregated at a specific time to ultimately form the opening or closing price. This mechanism effectively reflects the overall willingness of investors to buy and sell, as the final transaction price is based on the price equilibrium of all valid orders. This not only helps to reduce price volatility but also enhances market transparency and trading fairness, ensuring that all participants enjoy the same trading opportunities in the same market environment.
Moreover, it does help to increase market liquidity during this period as a large number of orders are submitted centrally. Investors submit buy and sell orders during this period, which are processed and aggregated centrally, helping to create clearer market opening and closing prices. This process reduces the likelihood of price volatility as the market is able to more effectively reflect the willingness of the majority of investors to trade at the open and close of the market, thereby enhancing market stability and predictability.
In addition, it does more than just determine the price of a stock at the opening and closing of the market; it provides market participants with important information about the price movement of a stock, which serves as a reference for them to make trading decisions. Through the buy and sell orders submitted during this period, investors can observe the supply and demand relationships and price levels in the market, thereby assessing the overall sentiment and expectations of the market. Such information not only helps to formulate short-term trading strategies but also provides clues for long-term investment decisions.
Overall, the call auction mechanism plays a very important role in the stock market. Through open price competition, it establishes the starting and ending prices for daily trading, ensures the openness and transparency of the market and the fairness of the prices, and also reflects investors' expectations and behaviors in the market. It has also become an important reference tool for investors in market operations.
What do the red and green bars in call auction mean?
| Type |
implication |
Interpretation |
| Red Column |
Strong buying |
Shows strong buying, possibly driving up the stock price. |
| Green Column |
Strong selling |
Shows strong selling, possibly driving the stock price down. |
| High Red |
Increased buying |
A higher red bar suggests strong buying, likely raising the price. |
| High Green |
Increased selling |
A higher green bar signals strong selling, likely dropping the price. |
Call auction Transaction Rules
As a mechanism for determining the opening and closing prices through the centralized aggregation of buy and sell orders before the stock market opens and closes, call auctions usually take place some time before the stock market officially opens, depending on the exchange's regulations. For example, in China's A-share market, this time is from 9:15 a.m. to 9:25 a.m.
During the period of the call auction, investors participate in the market by submitting limit orders. A limit order is a price specified by the investor to buy or sell a stock and will only be filled if the market price is at or better than the order price. This approach allows investors to participate in bidding under specific price conditions, ensuring that they are able to trade at the price they expect.
And during this trading process, the market aggregates and closes the transaction in accordance with the limit order submitted by the buyer and seller. This process follows the principles of price-first and time-first: orders with higher bid limits and lower ask limits are filled first, while orders at the same price are processed in order of priority. These rules ensure fair trading and market efficiency by creating a uniform opening or closing price for stocks within a limited time frame.
During this period, the principle of price priority guides the prioritization of high-priced buy orders and low-priced sell orders, which helps to establish market price stability. Exchanges usually set up stops and dips in Stock Prices, which are price ranges based on the closing price of the previous trading day. Up-and-down stops limit stock price fluctuations within a certain range, preventing abnormally large price swings and protecting investors' interests at the same time.
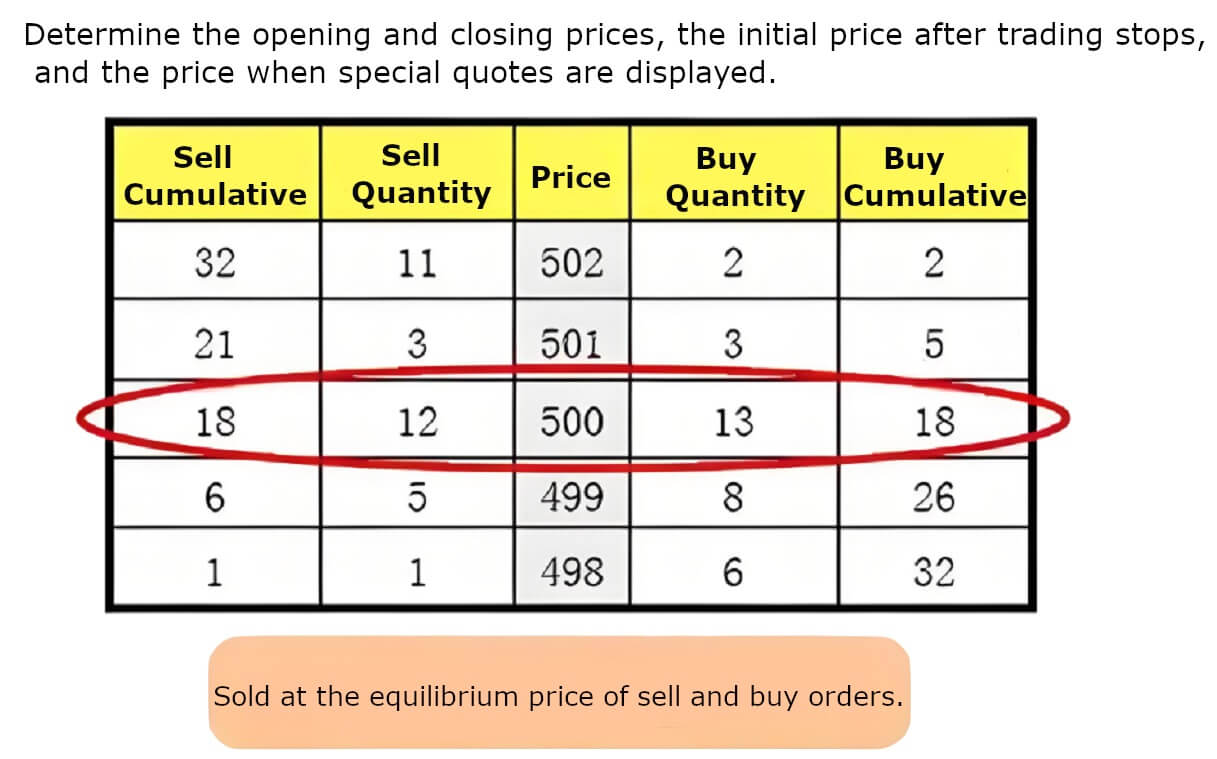
At the end of the call auction, the system closes the deal based on valid commission orders in the market. If there are multiple orders with the same price, the system will close them in the order in which they were submitted. Ultimately, the system will select the price that creates the largest turnover as the final opening or closing price, thus ensuring that market trading takes place in a fair and efficient environment.
At the same time, it also follows the principle of majority rule, i.e., in the case of multiple prices that can form the largest turnover, it will prioritize the price that can satisfy the largest number of entrusted orders as the final transaction price, so as to reflect the wishes of the majority of investors. Specifically, when the bidding ends, the system will summarize all the submitted buy and sell orders according to the principles of price priority and time priority for the transaction.
The principle of majority rule means that if there are a large number of buy orders and a small number of sell orders in a certain price range, or vice versa, the system will determine the final transaction price that will be formed based on the number of these orders. This not only ensures fairness in trading but also enables the prices in the market to reflect the wishes of a wide range of investors, thereby enhancing market transparency and liquidity.
In addition, during a call auction, if there are multiple prices capable of forming the same maximum turnover, the price closest to the closing price of the previous trading day is usually selected as the final opening or closing price. This practice helps to maintain market price continuity because a price that is close to the previous trading day's closing price can be viewed as the current consensus price level of market participants.
Suppose a stock's closing price for the previous trading day was $10. During a call auction, if there are multiple prices that maximize volume and the difference between open buy orders and open sell orders is equal, the trading system will select the price closest to the previous trading day's closing price as the final transaction price.
For example, assuming that in the collection of bidding processes, the following are stock buy and sell orders: buy orders (price, quantity): $9.80, 1.000 shares; sell orders (price, quantity): $10.20, 1.000 shares. There are also the following prices: Buy order (price, quantity): $9.90. 500 shares; sell order (price, quantity): $10.10. 500 shares.
In this case, the buy and sell orders at $9.80 and $10.20 are filled with equal volume and equal difference. The trading system then selects the price closest to the previous trading day's closing price ($10) as the final filled price. Thus, $10 or $10.10 may be chosen as the final transaction price to ensure market continuity and stability.
These rules ensure fairness in the market and price certainty during the call auction process, while also providing investors with an open and transparent trading environment. Through this mechanism, market participants are able to obtain valid market pricing information before the opening and closing of the market, which serves as an important basis for trading decisions.

Tips for buying and selling stocks through a call auction
A call auction is a very important trading session in the stock market, as it determines the opening price of a stock and also reflects the overall expectations and sentiment of the market towards the stock before the opening. During this period, in addition to understanding the specific rules and operational details, such as the validity period of the order, price range limits, etc., investors can also make use of a number of techniques to optimize their trading strategies and increase the likelihood of trading success.
First, observing red and green bars in the stock market is a common method of technical analysis. The red bar represents buying power; the higher the bar indicates strong buying demand; the green bar represents selling power; the higher the bar indicates increased selling pressure. By comparing the length and color shades of the red and green bars, investors can assess the contrast between the buying and selling forces in the market and assist in deciding whether to buy, sell, or hold a stock.
During a call auction, observing clear price trends or volume concentrated in specific price areas can be used as an effective trading strategy. Investors may consider following these trends, as they reflect a concentrated expression of a large amount of willingness to buy and sell in the market. However, the key to success lies in following the rules of trading, including well-timed entry and exit strategies and effective risk management to maximize trading success and profit potential.
Countertrend trading is a strategy whereby investors choose to trade in the opposite direction of the current prevailing trend when there are clear signals of a market reversal. This strategy requires caution to ensure that the reversal signal is confirmed through technical or fundamental analysis and that reasonable stop-loss levels are set to control risk. The execution of counter-trend operations requires strict adherence to a Trading plan, including clear entry points and target profit points, as well as continuous learning and adjustment of the strategy to improve trading success and long-term profitability.
Second, time segments can be utilized to determine capital intentions. The period between 9:15 and 9:20 in stock trading is known as the market trial or pre-opening period. During this period, investors are free to place and withdraw pending orders to test market reactions and adjust trading strategies.
Trial orders are temporary and usually not immediately filled, and investors can adjust or cancel their orders at any time according to market changes. The market trial period provides investors with an opportunity to assess market supply, demand, and price movements, which helps them be prepared before the official opening of the market.
In stock trading, 9:20 to 9:25 is the core phase of the call auction. During this time, investors submit a commission order that can no longer be withdrawn; hence, it is known as the real chip-grabbing moment. The focus of this stage is to observe the pending orders, i.e., the number and price at which investors are willing to buy or sell shares. Pending orders reveal the strength of the market and investors' trading intentions and help predict the next price movements and market sentiment.
And when it comes to the 9:24 to 9:25 period of stock trading, it is considered a critical time to grab chips. During this time, investors pay close attention to the market, and really strong stocks will show signals of a chip grab during this minute. This means that investors may focus on snapping up stocks that they believe have potential in order to chase possible upside or profit opportunities. Activity during this minute often has an impact on the day's market action and is considered an important strategic moment in the market.
Snap signals are important indicators used by investors in the stock market to determine whether a stock is attracting a large amount of capital attention and participation. You can observe the density of white dots in the market transactions. These white dots represent large single transactions, and if they appear frequently, it indicates that the stock is highly active and receiving significant capital attention.
At the same time, it is vital to pay attention to the volume changes in the five minutes from 9:20 to 9:25. Especially if the volume increases significantly during this period, especially if the volume of the positive line significantly exceeds that of the negative line and the volume is enlarged by at least two times compared to the previous one, this is usually regarded as a signal that the funds are actively snatching chips.
In addition, investors will watch for turnover amounts and the number of large orders during the last minute before the market opens, i.e., between 9:24 and 9:25. If the turnover amount gradually increases during this period and there are large orders, this shows signs that there are funds actively grabbing the stock at the last minute.
During the call auction phase, investors also need to pay attention to the growth in volume and price fluctuations, which can be realized through professional stock trading software or online trading platforms. Bid snatching is usually characterized by a sudden increase in volume and rapid price fluctuations, which tend to attract the attention of a large number of investors.
Secondly, after the opening of the disk, you can further confirm the grabbing of stocks by observing the time chart. For example, when the timing chart of the white line (usually the price line) is located above the yellow line (such as the average line or other reference line) and the yellow line is located above the zero axis (price axis), this structure shows that the stock price is strong in intraday performance and is an indicator of active chip grabbing.
It is also possible to focus on the pattern of volume changes, especially positive volume and negative volume. Positive volume usually indicates a strong uptrend in the market, which may continue to push the stock price up, and investors may consider buying at this time. On the contrary, a negative contraction indicates weakening sellers' forces, which may indicate that the short trend is about to end or turn into a long one, so investors can wait and see or look for counter-trend buying opportunities.
This technical analysis method, which combines the call auction stage and intraday time charts, helps investors identify and grasp the hot stocks and bargaining opportunities in the market. However, investment decisions still need to take market risks and individual investment strategies into account to ensure effective trading decisions and risk control.
Disclaimer: This material is for general information purposes only and is not intended as (and should not be considered to be) financial, investment, or other advice on which reliance should be placed. No opinion given in the material constitutes a recommendation by EBC or the author that any particular investment, security, transaction, or investment strategy is suitable for any specific person.
Tips for buying and selling stocks through a call auction
| Descripción |
Purpose |
| Analyze the red and green bars and price moves. |
Anticipate price moves and create trading strategies. |
| Set the price range for buying or selling. |
Participate in bids at target prices to boost trading. |
| Watch volume and price from 9:20 to 9:25. |
Spot hot stocks and opportunities to optimize trades. |
| Analyze bullish and bearish volume changes. |
Identify strong and weak stocks to improve forecasts. |
| Set stop losses on reversal signals. |
Reduce risk and increase long-term profit potential. |
Disclaimer: This material is for general information purposes only and is not intended as (and should not be considered to be) financial, investment, or other advice on which reliance should be placed. No opinion given in the material constitutes a recommendation by EBC or the author that any particular investment, security, transaction, or investment strategy is suitable for any specific person.


