Do you feel lately that your wallet seems a little more deflated than it used to be? Don't worry; it may not just be your desire to spend that's to blame. In fact, changes in currency may also be quietly affecting your life. Among the financial data released by the People's Bank of China every month, money supply figures are key indicators that reflect the liquidity of funds. Today, we will explain the definition and impact of the M0 indicator in detail.
 What is M0?
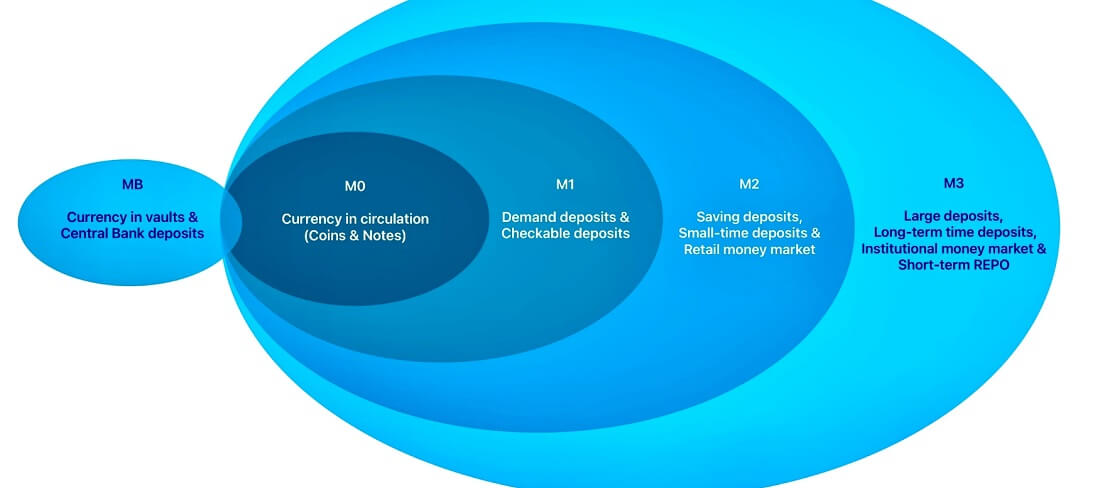
It is the most basic component of the money supply and is often referred to as "base money" or "narrow money." It is the total amount of cash circulating in the economy, including notes and coins, and does not include reserves or other forms of deposits held by commercial banks. It is the most liquid and readily tradable part of the money supply and the most basic measure of the money supply.
It consists of two main components: notes and coins held by the public, and commercial banks' reserves on deposit with the central bank. Notes and coins are the cash actually circulating in the market, while bank reserves are the account balances of commercial banks with the central bank, which are also included in the calculation of M0.
Together, these components make up M0. As the most basic level of the money supply, it is a direct reflection of cash flow and liquidity in the economy. Because these forms of money circulate quickly and are immediately available for transactions, they also exhibit their most liquid characteristics, thus having a direct impact on daily transactions and economic activity.
This is mainly because M0 contains all the cash currently in circulation, which can be used immediately for the purchase of goods or services and has immediate payment capacity. Therefore, as the most basic and liquid form of money, it is able to directly support transactions and payments, ensuring smooth economic activity.
In addition, as the most fundamental indicator of the money supply, it is of vital importance in understanding the flow of money and the health of the economy. It provides direct information on the amount of cash in the market, making it a key tool in measuring the liquidity and overall stability of the economy. By accurately reflecting the actual cash in circulation in the market, it helps to analyze the liquidity and stability of economic activity and provides an important basis for monetary policymaking and economic analysis.
It is therefore used by policymakers to assess the potential impact of monetary policy changes on inflation, interest rates, and economic activity. By monitoring M0. policymakers are able to gain insights into cash flows in the market and the cash requirements of the economy, thus providing an important basis for formulating and adjusting monetary policy. In this way, they can get a more accurate picture of the liquidity and stability of the economy and thus optimize monetary policy to meet economic challenges.
In addition, it is a fundamental tool of monetary policy. Central banks regulate the economy by regulating base money to influence the money supply in the economy. An increase in it will directly increase the amount of cash in circulation in the market, while a decrease will reduce the amount of cash in circulation, which will in turn affect economic activity and inflation.
Central banks can use monetary policy tools (such as open market operations and the rediscount rate) to regulate M0. For example, central banks use open market operations, such as buying and selling government bonds, to increase or decrease the amount of base money in the market. Such operations directly affect it, thereby adjusting liquidity and the overall money supply in the economy.
Both it and M1 are referred to as narrow money, but they differ in scope.M1 includes M0. i.e., cash circulating in the market (e.g., banknotes and coins), as well as demand deposits at commercial banks. By contrast, M1 is a broader indicator because it covers not only cash but also demand deposits, which can be quickly converted into cash. This allows M1 to provide a more comprehensive view of the money supply, showing the importance of available forms of money other than cash in the economy.
M0 and M2. on the other hand, are even more different, not only in the type and scope of money they contain. It is important to realize that M2 includes not only M1 (i.e., cash and demand deposits) but also time deposits and money market accounts, reflecting the wider money supply and overall liquidity of the economy. However, it is less liquid for bananas.
In summary, M0 reflects the amount of base money in the economy and is the smallest link in the money supply. It is an important measure of the amount of cash actually available in an economy and is commonly used to analyze and formulate monetary policy to influence economic activity, interest rates, and inflation. At the same time, it directly affects the amount of money available in the banking system and is an important tool for central banks to implement monetary policy.

What does the increase in M0 mean?
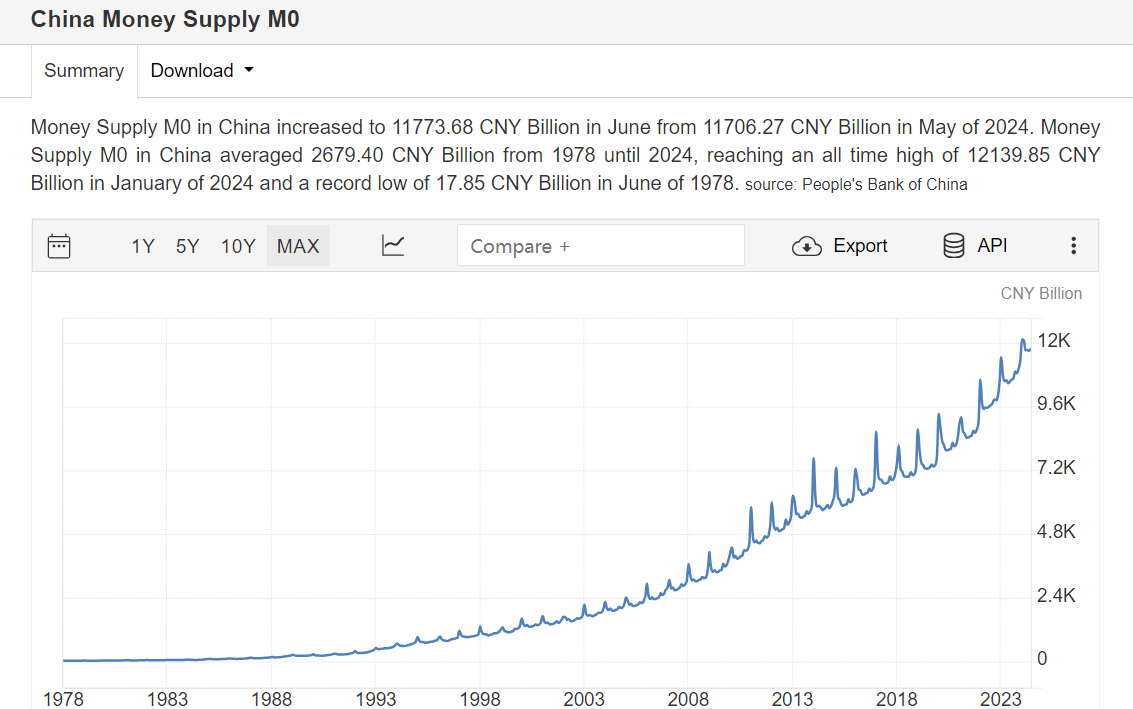
According to financial statistics at the end of April, China's M0 balance of cash in circulation increased by 10.8 percent year-on-year to 11.730 billion yuan. There are two main reasons for this: firstly, a decrease in cash on hand at banks, usually due to more cash withdrawals or fewer deposits by customers; secondly, an increase in currency issuance, where the central bank expands the supply in the market by printing new money.
And the growth in M0 money usually reflects an increase in market demand for cash, which means that people are making more transactions and spending. As cash becomes more liquid, market activity increases, and economic activity is likely to be more prosperous. This growth usually indicates that consumers and businesses have a positive outlook on the economy and are willing to increase spending, which in turn drives overall economic dynamism.
Its increase usually significantly enhances market liquidity, resulting in a significant increase in available funds in the banking system. With elevated liquidity, banks have more funds available for lending, which typically lowers borrowing costs and thus stimulates investment and spending by businesses and individuals.
Particularly during an economic slowdown, an increase in M0 is an effective monetary policy tool that can help boost economic growth. By lowering interest rates and increasing the supply of funds, firms are able to obtain more financing support for expanding their businesses and investing in new projects, while consumers are likely to spend more as a result of lower borrowing costs. Such measures can not only restore market vitality but also promote the recovery and development of the economy as a whole, thus having a positive impact on economic growth and the job market.
Meanwhile, more cash flowing into the market boosts consumers' purchasing power and stimulates consumer demand. And with more capital, businesses can invest and expand, thus boosting economic growth. In addition, more cash in the market means that commercial banks also have more funds for lending, which may further boost economic activity and financial market activity.
However, a prolonged increase in M0 could also bring about inflationary pressures. If the supply of cash in the market increases without a corresponding increase in the supply of goods and services, this can lead to an increase in the price level, i.e., inflation. Inflation reduces the real purchasing power of money, which may have a negative impact on the cost of living for consumers, making goods and services more expensive.
The market's reaction to its increase is often reflected in the volatility of asset prices. The inflow of more liquidity into the market usually pushes up the prices of assets such as equities and real estate, as the availability of funds increases the demand for these assets. This phenomenon is particularly pronounced in the context of economic easing, where a boom in asset markets can reflect optimistic market expectations about the economic outlook.
In addition, its increase may have an impact on currency exchange rates. If base money grows too fast, it may lead to a depreciation of the national currency. Such a depreciation not only affects international trade by making exports more competitive but also may change the cost of capital flows and affect the balance of cross-border investment and financial transactions.
That said, increases in M0 usually reflect the monetary policy operations of central banks aimed at adjusting liquidity in the economy and supporting economic growth. However, prolonged and excessive increases may also carry risks of inflation and market instability. Therefore, policymakers need to balance changes in the money supply to achieve economic stability and sustainable growth.

Impact of Changes in M0 Data
Changes in it have far-reaching implications for the economy, ranging from liquidity and borrowing to inflation and market prices. The Central Bank therefore closely monitors M0 and other money supply indicators to formulate and adjust monetary policy aimed at maintaining economic stability and promoting growth. Policymakers must find a balance between increasing liquidity and controlling inflation in order to achieve long-term, stable economic growth.
Generally speaking, an increase in M0 boosts market liquidity, enabling the banking system to provide more loans and investments, thereby lowering interest rates and encouraging businesses and consumers to borrow and spend more, which in turn stimulates economic growth and overall economic activity. A fall in it, on the other hand, reduces market liquidity, raises interest rates, and limits the ability of banks to lend, potentially discouraging business investment and consumer spending, which in turn has a negative impact on economic growth.
And prolonged or excessive increases in it could lead to inflation, as money growth in excess of economic growth pushes up prices and could lead to currency depreciation, affecting imports and trade. Conversely, a fall in M0 could trigger a liquidity crunch, with less funding and higher interest rates, which could dampen consumption and investment, possibly to the detriment of economic growth, and lead to Currency Appreciation, affecting export competitiveness and international trade.
At the same time, changes in its data are usually seen as signaling the monetary policy of the central bank. An increase in it indicates an easing policy to stimulate the economy, while a decrease indicates a tightening policy to curb inflation. Such changes affect market expectations and strategies, which in turn affect investment and consumer confidence.
And both the monetary policy decisions of central banks and the market's reaction to these decisions are crucial to investors' investment strategies. As such, investors usually pay close attention to changes in these data in order to adjust their investment strategies, look for market opportunities, and hedge against potential risks.
When M0 increases too rapidly, it may trigger inflationary expectations and reduce the purchasing power of money, which is bad for fixed-income investments such as bonds but good for real assets such as real estate and precious metals. Conversely, its fall could lead to a liquidity crunch and higher interest rates, which could dampen consumption and investment, negatively affecting economic growth and potentially appreciating the currency, affecting export competitiveness and international trade. Investors should be mindful of the impact of inflation on returns and adjust their strategies to cope with economic instability.
Its increase may also drive up the prices of equities, property, and other assets, as increased liquidity brings more money into the market. However, excessive increases could lead to market instability and price volatility. Its decline could trigger a liquidity crunch, pushing up interest rates, dampening consumption and investment, and negatively affecting economic growth, while potentially leading to a fall in asset prices and currency appreciation, affecting export competitiveness.
At the same time, its increase could lead to currency depreciation, affecting the exchange rate, raising the cost of imports, disrupting international trade, and altering the pattern of capital flows, reducing the return on international investment. Its fall, on the other hand, may cause the currency to appreciate, improve the exchange rate, reduce the cost of imports, and attract international capital inflows. However, a tight monetary policy may dampen economic activity, depress asset prices, and reduce market liquidity, making it difficult for firms to raise finance and affecting the stock and property markets.
For ordinary people, changes in the M0 figure have an equally significant impact. It directly affects the cost of living, savings rates, and borrowing costs, as well as asset price volatility. Overall, its fluctuation after three months touches the daily lives and finances of ordinary people in several ways.
Its increase may trigger inflation, push up the prices of goods and services, and increase the cost of living for households. Even if wages rise, real purchasing power may fall when prices increase more. It may also push up the demand for real estate and house prices, benefiting homeowners but exposing homebuyers to higher costs. Meanwhile, the stock market may also rise, bringing higher returns on investment but potentially triggering market volatility.
Changes in M0 reflect the central bank's expectations for the economy, and its increase is usually aimed at stimulating economic growth, potentially boosting consumer confidence and prompting an increase in consumer spending. It is often accompanied by central bank interest rate cuts, which can lead to lower interest rates on savings and thus reduce savings returns.
However, lower interest rates also reduce the cost of borrowing, making home and car loans cheaper and more beneficial to borrowers. It is important to note, however, that increased M0 could lead to currency depreciation, affecting the exchange rate, exposing international travel and foreign exchange transactions to exchange rate risk, and increasing the cost of foreign goods and services.
In short, changes in M0 profoundly affect the economy and the lives of individuals. It not only reflects changes in the money supply but also reveals the health of the economy and the direction of monetary policy. By observing changes in its data, economists and policymakers are able to gain important information about market liquidity, inflation, currency depreciation, and economic growth and thus adjust policy and investment strategies to affect overall economic stability and development.
Definition and impact of the M0 indicator
| Description. |
Impact |
| M0 is circulating cash, coins, and bank reserves. |
The most liquid and direct reflection of cash flow. |
| Components: public cash and bank reserves |
Supports daily transactions and economic activity. |
| Characterized by immediacy and high liquidity |
Impacts consumption, investment, and growth. |
| Increases boost, decreases depress the economy. |
Adjusts interest rates, inflation, and economic activity. |
| M1 and M2 contain more Types of Money. |
Affects costs, savings, borrowing, and assets. |
Disclaimer: This material is for general information purposes only and is not intended as (and should not be considered to be) financial, investment, or other advice on which reliance should be placed. No opinion given in the material constitutes a recommendation by EBC or the author that any particular investment, security, transaction, or investment strategy is suitable for any specific person.


 What is M0?


