Supply-and-demand issues in the trading market have always been the focus of
traders. Understanding and correctly applying the concepts of supply and demand
can help traders better grasp market trends and make more informed trading
decisions. However, many friends have questions about how to accurately identify
supply and demand areas.
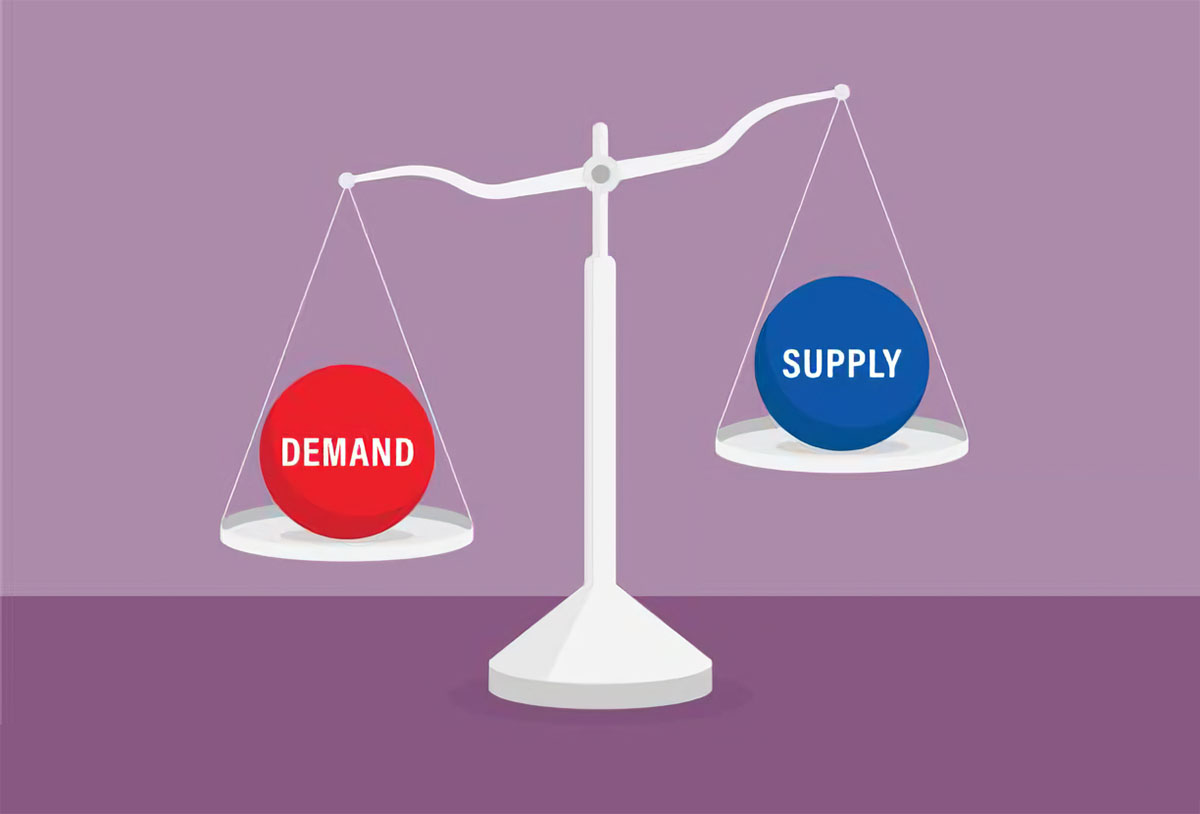
1. What is supply and demand?
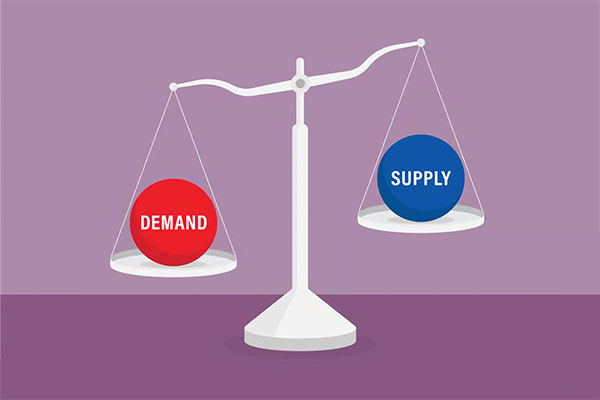
Supply refers to the quantity of assets available.
Demand, on the other hand, represents the amount of an asset that traders
wish to purchase.
If demand exceeds supply, high demand will cause prices to rise, indicating
that there are a large number of buyers competing to acquire the asset.
Conversely, if supply exceeds demand, it means sellers are competing for
buyers. As a result, asset prices will fall.
The key takeaway is that there is an interrelationship between supply,
demand, and price movements. High demand drives prices up, while high supply
drives prices down.
2. What are supply areas and demand areas?
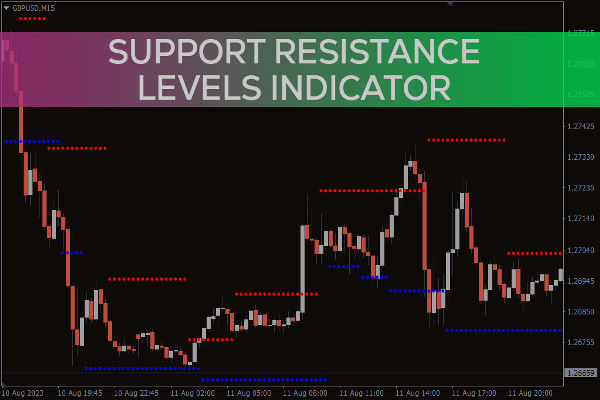
It is the basic theory that prices will form trading areas between supply and
demand. Supply and demand areas refer to areas where high demand forms support
or high supply forms resistance that can be identified on a price chart. In
fact, many traders just think of them as synonymous with support and resistance
zones or pivot zones, but the two concepts can still be distinguished from each
other, and the specific differences may vary depending on the individual
trader's definition.
Generally speaking, the demand zone refers to when the buying orders are
greater than the selling orders; that is, the demand is greater than the supply,
and the price will rise. For example, if the stock price is ten yuan, many
people are willing to buy it at this price or even higher. This will push the
stock price higher because the buying power is greater. When the stock price
returns to this area, people who have not bought before will rush to buy,
continuing to push the stock price up.
On the contrary, the supply zone means that the power of sellers is greater
than the power of buyers; that is, if the supply exceeds the demand, the price
will fall. For example, if the stock price is eight yuan and the seller sells
the stock at this price but the buyer is only willing to buy it for seven and a
half yuan, the supply exceeds the demand and the stock price will fall.
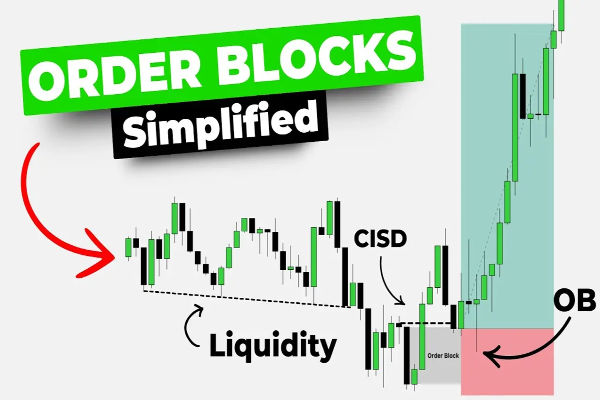
Another way to distinguish the difference between support/resistance and
supply/demand areas is to consider their origin. Some traders believe that only
imbalanced areas generated by large institutions can be called "supply and
demand" areas, while the reasons for "support/resistance" areas are not specific
enough.
There may be differences between traders regarding the exact rules for
drawing supply and demand areas. This could be another difference between the
two concepts if the rules for identifying supply and demand areas are more
specific and narrow compared to the rules for identifying areas of support and
resistance.
Some investors also believe that supply and demand areas should be defined by
narrower, more specific price ranges, while support and resistance areas can be
defined by broader ranges.
There is no absolutely correct "official" answer to this question, so once
you understand the basic concept of supply and demand zones, you can define them
in your trading in your own way.
That said, supply and demand zones and support and resistance zones are very
similar, and the exact difference depends on who you ask, and different traders
have different definitions of the two concepts.
3. Why should we identify the supply and demand areas, go long in the demand
area, and go short in the supply area?
Because prices trade between supply and demand, If the supply zone is
breached, prices are expected to move toward a better supply zone. Similarly, if
the demand zone is breached, prices are expected to move back to the next better
demand zone.
For prices, it's like a ball bouncing between supply and demand. When supply
is broken, the price reaches the next better supply zone and then bounces back
to the demand zone. If the demand zone fails and is breached, expect the price
to push back and continue to the next better demand zone. The same is true for
the supply zone. After the price falls, if the demand zone supports the first
supply zone and the price is not blocked but pulls back or passes directly
through, the price is expected to reach the next supply zone.
Identifying supply and demand areas can help traders make more informed
decisions. For example, in a demand zone, traders may choose to buy when prices
are low, while in supply zones, they may choose to sell when prices are
high.
The level of the price will affect the willingness of traders. The higher the
price, the stronger the willingness of sellers; the lower the price, the
stronger the willingness of buyers. This is an aspect of the supply-and-demand
principle. Rational investors are more willing to buy when prices are low and to
sell when prices are high. This is because when prices are low, more assets can
be purchased, while when prices are high, purchasing power is relatively
weakened.
Going long near demand areas may result in profits on price rallies, as these
areas may signal buyers regaining control of the market. Shorting near supply
areas may result in profits following price rallies, as these areas may signal
sellers regaining control of the market.
4. How do you find supply and demand areas?
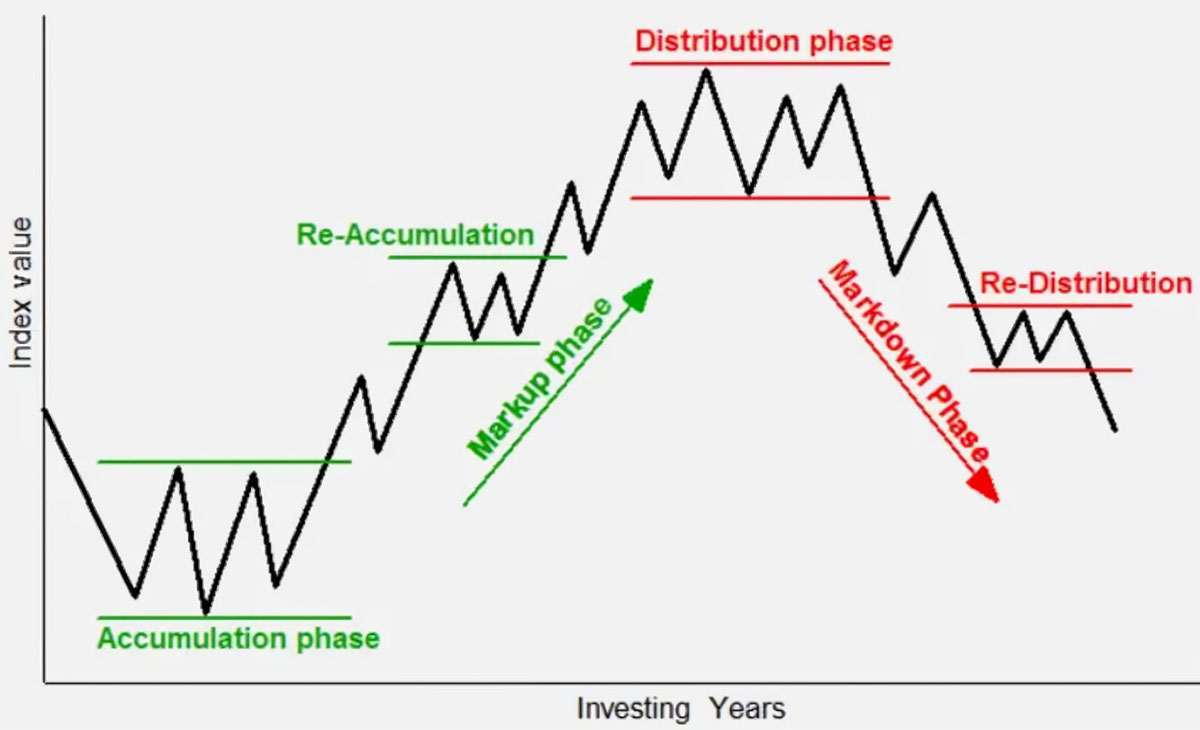
First of all, you must understand that what you are looking for is the
fluctuating area, that is, the oscillating area. Whether it is the supply area
or the demand area, what we are looking for is a shock range. For the supply
zone, there are two basic forms: rising first, then oscillating, and then
breaking through (rising, flat rising), or rising, then oscillating, then
falling (rising, flat falling), both of which are part of the shock zone.
The most common form is a rise followed by a swing, sideways movement, and
then a fall, which usually indicates a trend reversal. Another form is a
continuous rise followed by a shock and then a rise again, which indicates a
continuation of the trend. In either case, what we are looking for is an area of
shock. Within a swing zone, prices create trading opportunities between supply
and demand.
The above are the basic four forms, and there may be many variations in
actual situations.
After identifying the supply and demand areas, the next step is how to use
this information to trade. When entering the market, if it is in the supply
area, we should enter the market at the bottom edge to go short; if it is in the
demand area, we should enter the market at the top edge to go long. Stop-loss
trading is an important part of trading. Stop loss can be set at the highest
point of this area. In order to increase the error tolerance, it can be slightly
larger. If the range is large, you can also consider entering the market at 50%
of the range to reduce the stop-loss distance.
This is just the introductory knowledge of supply and demand trading. In
actual application, more technical indicators and the market environment need to
be combined to make judgments.
supply vs demand
|
Supply |
Demand |
| Definition |
Quantity of available assets |
Quantity of assets traders wish to purchase |
| Price Impact |
High supply leads to price decline |
High demand leads to price increase |
| Region |
Supply Zone |
Demand Zone |
| Characteristics |
Sellers' strength surpasses buyers' strength |
Buyers' strength surpasses sellers' strength |
| Correlation |
Supply zone forms resistance on price chart |
Demand zone forms support on price chart |
| Trading Strategy |
Shorting in the supply zone |
Going long in the demand zone |
| Price Behavior |
Forms after a price increase |
Forms after a price decrease |
5. How to draw supply and demand areas
First, you need to decide which time-level chart to draw on. Generally
speaking, the supply and demand zone at a larger time level is more reliable and
effective. You can use daily and weekly charts to find the supply and demand
zones, and then use a chart at a smaller time level for specific entry and exit
operations.
-
Draw demand areas
First, determine the trend and find the highs and lows. When drawing the
demand zone, you need to pay attention to the high and low points of the trend.
When the stock price breaks through the previous high point and forms a high
point, you can start to draw the demand zone. The demand zone is drawn from the
lowest point to the entity of the first white candlestick. top.
Regarding the hidden demand area, although it seems that there is no callback
to form a low point, if you take it apart, you will find that there is actually
a callback. When drawing the hidden demand zone, you need to pay attention to
the lower shadow being longer than the previous candle, and ensure that the
candle that breaks through the previous high is a white candle.
When drawing the demand zone, there are two important conditions to be met:
First, the candle must break through the previous high, whether it is the upper
shadow line or the real body. Second, the candle must be a white candle. Only
when these two conditions are met can the demand zone be established.
To draw a demand area
Watch price charts
Similar to mapping supply areas, start by looking at the price chart and
looking for areas where the price bounces or finds resistance. These areas
usually indicate a large number of buy-in orders entering the market, creating
an area of demand.
mark low
Mark the low point of the demand area on the price chart. These lows are
usually where prices start to rise after a rebound, showing that there is a
certain amount of buying in the market.
Connect low
Create a straight line or a distinct area by connecting the marked low
points. This will help traders more clearly identify the scope of demand areas
and thus better formulate trading strategies.
-
Drawing of supply areas
Similar to mapping demand zones, mapping supply zones requires identifying
trends and finding lows and highs. In a downtrend, when the stock price falls
below the previous low, forming a low low, the candle must be a black candle.
Once these two conditions are confirmed, you can start to draw the supply
zone.
The supply zone is drawn from the high end to the real body bottom of the
first black candlestick. When drawing the hidden supply zone, you need to pay
attention to the upper shadow line of the black candlestick being longer than
the previous candlestick, ensuring that the candlestick that broke through the
previous low is a black candlestick.
By understanding how supply and demand zones work and how to draw them, you
can begin to use them to develop your own trading plans. When making a plan, you
need to draw the demand zone on the weekly chart and wait for the stock price to
fall back to the vicinity of the demand zone before entering the market. The
specific entry point can be when the stock price breaks through the previous
high. In addition, the ATR indicator can be used to set stop-loss points to
ensure that false breaks can be avoided.
To draw a supply area
Watch price charts
First, traders need to carefully watch the price chart to look for obvious
areas where the price rebounds or encounters resistance. These areas usually
indicate a large number of sales orders entering the market, creating a supply
area.
mark highs
Mark the high point of the supply area on the price chart. These highs are
usually where prices start to fall after a rebound, showing that there is a
certain amount of selling in the market.
connect high points
Create a straight line or a distinct area by connecting the high points of
the markers. This will help traders more clearly identify the extent of supply
areas and, thus, better formulate trading strategies.
6. Successful supply and demand operation processes in the trading market
-
Understand the basic concepts of supply and demand.
Before we delve deeper, we first need to understand the basic concepts of
supply and demand. Supply refers to the quantity of a good or service that
sellers are willing to provide in the market, while demand refers to the
quantity that buyers are willing to buy. When supply and demand reach
equilibrium at a certain price, the market will form an area of support or
resistance.
-
Comprehensive market research and trend analysis
Before formulating any Trading plan, investors first need to conduct
comprehensive market research and trend analysis. By checking historical price
trends and related news, you can understand the fundamental factors of the
market and judge the overall trend of the current market. This step helps
investors clarify the overall direction of the market and lays the foundation
for the subsequent identification of supply and demand areas.
-
Effective price chart analysis
In practice, effective price chart analysis is the core of successful
supply-and-demand operations. Traders need to learn to identify and draw supply
and demand lines. By observing clear areas of price rebound or resistance,
marking high and low points, and connecting forming areas, potential supply and
demand areas can be more accurately determined, and traders can identify key
levels in the market. Horizontal support and resistance are typically areas of
supply and demand that may be formed by large trades, technical indicator
signals, etc.
-
Pay attention to trading volume
Understanding volume is also critical to identifying supply and demand areas.
Large volumes of trading may signal important supply or demand changes in the
market, and increases or decreases in volume can provide clues about market
momentum and help confirm the authenticity of supply and demand areas.
-
Use technical indicators to aid analysis
In addition to charts and volume, technical indicators are also powerful
tools for identifying supply and demand areas. Commonly used indicators such as
moving averages, relative strength indexes, etc. can help traders more
accurately determine market trends and possible reversal points. The
determination of supply and demand areas should be combined with other technical
indicators, such as moving averages, relative strength indexes, etc., which
helps to reduce the misleadingness of a single indicator, and the comprehensive
use of multiple indicators can increase the reliability of trading
decisions.
-
Consider the time factor
The availability of supply and demand areas may change over time. Successful
traders need to consider timing factors, such as Intraday Trading versus
long-term trends, to better select supply and demand areas. Supply and demand
areas on different time frames can have different influences, so traders should
consider multiple time scales together.
-
Identify key support and resistance levels
By combining the above analysis, traders can identify key support and
resistance levels. Support levels usually correspond to demand areas, while
resistance levels correspond to supply areas. These key points are the basis for
formulating trading plans and deserve sufficient attention in actual
operations.
-
Develop a trading plan
With a solid understanding of supply and demand areas, the next step is to
develop a trading plan. A clear plan helps reduce emotion in decision-making and
improves operational discipline. In planning, traders need to consider key
elements such as entry points, stop-loss levels, and profit targets. In
addition, reasonable risk management strategies are the key to ensuring
successful trading and cannot be ignored.
-
Continuous optimization in practice
The formulation of a trading plan is only the first step, and continuous
summary and optimization in practice are equally important. Traders should
always pay attention to market changes and flexibly adjust trading plans to
adapt to the development of different situations. Market fluctuations are
inevitable, and traders should be able to respond calmly and not change their
trading plans due to short-term market fluctuations. Waiting patiently for
trading opportunities that fit your plan is the key to maintaining stable
profits.
Disclaimer: This material is for general information purposes only and is not intended as (and should not be considered to be) financial, investment or other advice on which reliance should be placed. No opinion given in the material constitutes a recommendation by EBC or the author that any particular investment, security, transaction or investment strategy is suitable for any specific person.
