When analysing trading charts, you'll notice certain formations appearing repeatedly. Some traders use these to identify new opportunities. Here, we're going to delve into the Chart Patterns you should be familiar with and recognise.
What is a Chart Pattern?

A chart pattern is a recurring price action. The concept behind chart pattern analysis is that by understanding what happened after a pattern in the past, you can make an informed guess about what might occur when it reappears.
Recognising a trend reversal is crucial as it signals a potential shift in market direction, helping traders make informed decisions.
The outcome of each chart pattern will vary depending on whether it appears in volatile or calm markets and bullish or bearish environments. But broadly speaking, there are three types of patterns you'll encounter.
Common Types of Chart Patterns
Continuation patterns - these signal a temporary pause in price action within an ongoing trend before it potentially resumes. Examples include triangles, flags, and pennants.
Reversal - these indicate a trend is about to change direction
Bilateral - these patterns suggest a market could move in either direction due to volatility
Now that we know the basics, let's explore some of the most common chart patterns in technical analysis.
1. Ascending triangle
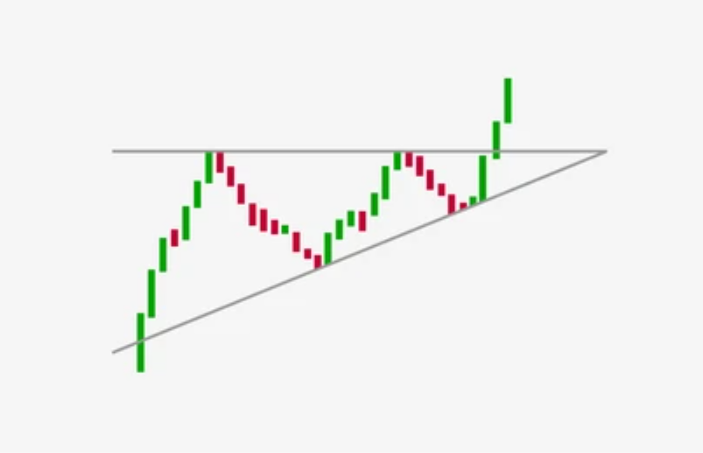
The ascending triangle is a chart pattern that's created when a horizontal set of highs is met by an ascending set of lows. The upper horizontal line is the resistance level, and the lower upward-sloping line is the support.
It is a continuation pattern, usually appearing after an uptrend. Throughout the pattern, the market consolidates (which means the trend stalls), but if it breaks out above the resistance line then a new uptrend should form.
As we'll cover below, traders usually look to confirm a pattern before they start trading. One way to confirm an ascending triangle is to look at volume indicators – activity should decline within the pattern, but then quickly pick up as the breakout takes hold. If this arises, then the price is more likely to continue upwards.
Although the price does typically break out in the same direction as the prevailing trend, it doesn't always happen. Ascending triangles can also indicate the start of a downtrend if the price breaks lower or the volume declines.
2. Descending Triangle
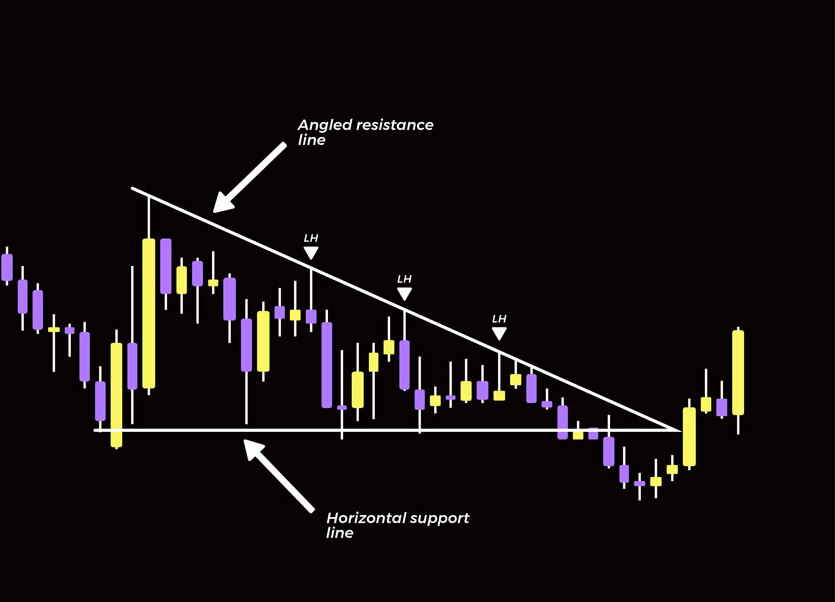
The descending triangle is the opposite of an ascending one and is one of the key descending triangles traders look for. It usually occurs after a downtrend and is formed when a horizontal set of lows (the support level) is met by a descending set of highs (resistance).
It's also considered a continuation pattern, telling us that the market is likely to break out lower through the support level, making it a bearish signal. However, if the market breaks out through resistance instead, it may mean the beginning of a new uptrend.
As with its ascending counterpart, falling volume within the pattern followed by a spike as the market breaks out can make for a stronger signal.
3. Symmetrical triangle
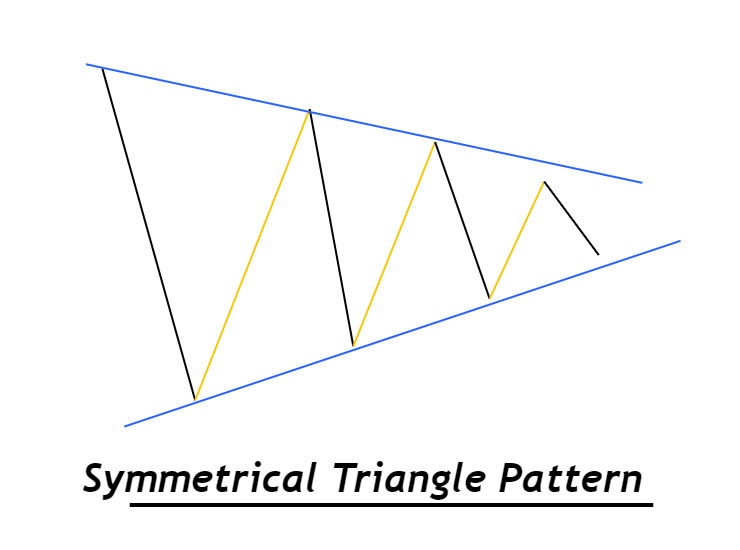
Symmetrical triangles occur when two trend lines approach one another. Essentially, it's like if you overlaid an ascending triangle onto a descending one – and got rid of both of the horizontal lines.
The symmetrical triangle can signal a few different things, depending on market conditions.
It's often considered a continuation pattern because the market usually continues with the prevailing trend. However, if there is no clear trend before the pattern forms, it's a bilateral pattern and the price could go in either direction. Once a breakout in either direction is confirmed, it suggests that the trend is likely to continue in that direction.
To trade a symmetrical triangle, be ready for the market to break out in either direction. Then watch to see whether that turns into a new trend, and buy or sell accordingly.
4. Flag
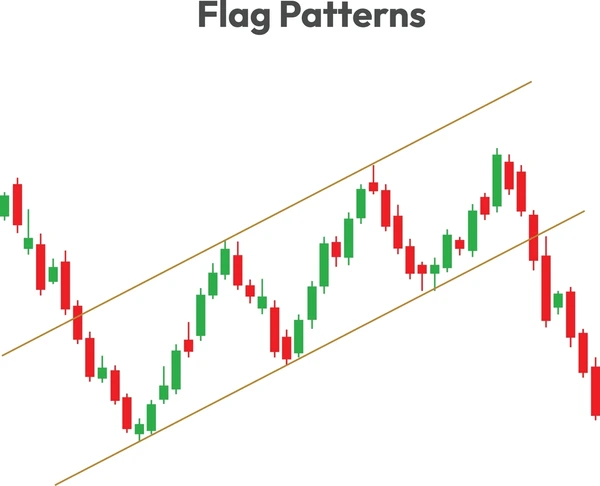
A flag pattern is created when a market's support and resistance lines run parallel to each other, either sloping upwards or downwards. It culminates in a breakout in the opposite direction to the trendlines.
In a bullish flag, both lines point downwards and a breakout through resistance signals a new uptrend
In a bearish flag, both lines point upwards and a breakout through support signals a new downtrend
A similar pattern to the flag is the pennant chart pattern, which also indicates a potential breakout after a period of consolidation.
Although they can be considered reversal patterns – after all, the price action within the flag reverses when the breakout occurs – flags are usually classed as continuation signals because they tend to occur after uptrends (bullish flags) and downtrends (bearish flags).
Think of it in three parts: a strong directional move, followed by a slow counter-trend – the 'flag' – and a breakout.
5. Wedge
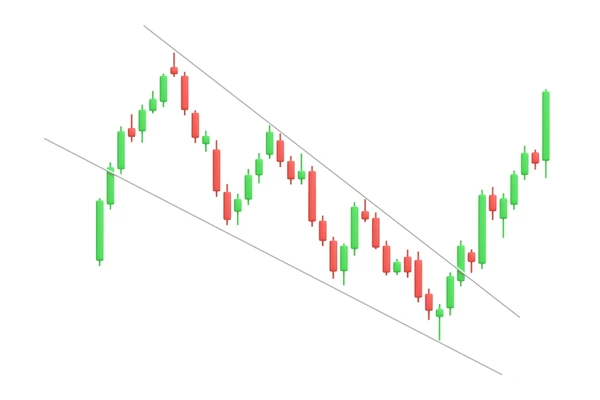
A Wedge Pattern is similar to a flag, except that the lines tighten toward each other instead of running parallel. As the pattern progresses, it often coincides with a decline in volume.
A wedge pattern can either be rising or falling. After a rising wedge pattern, the market should break out downward, passing the support level, making it a bearish pattern. This presents opportunities for a new bearish position or might be a sign to close a long one.
For a falling wedge, the price should break through a resistance level to start an uptrend. You can open a long position at this point, or close a short one.
Some traders even choose to enter short-term trades within the wedge pattern, taking smaller profits from the oscillations between support and resistance.
6. Double Top
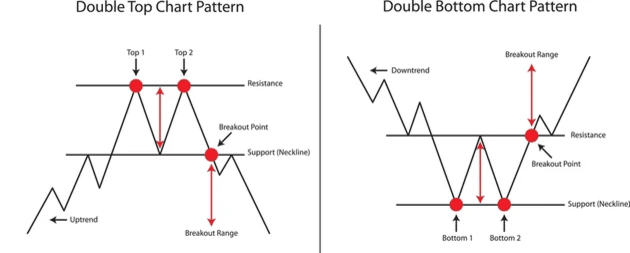
A double top pattern forms when a market's price reaches two consecutive highs with minor declines in between, creating an 'M' shape on the chart.
This pattern is recognised as a bearish reversal pattern, suggesting that the asset's price will likely drop below the support level established at the low point between the two peaks. It's essential to confirm this support level, as relying solely on the presence of the two peaks might lead to a false reading.
In a double top, a market trending upward attempts to reach new highs twice, but both times it retraces as selling pressure drives the price down—a signal that bullish momentum may be weakening.
Often, the second peak won't be as high as the first, indicating a potential end to buying pressure.
8. Double bottom
A double bottom is, as expected, the reverse of a double top. It forms when a market's price makes two unsuccessful attempts to break through a support level. Between these attempts, there's a temporary price increase to a resistance level, creating a 'W' shape.
This pattern is considered a bullish reversal pattern because it typically indicates the end of selling pressure and the beginning of an upward trend. Thus, if the market price surpasses the resistance level, it is likely to continue climbing.
Similar to a double top, it's crucial to verify the resistance level before entering a position. Many traders achieve this by examining past price movements or employing technical indicators.
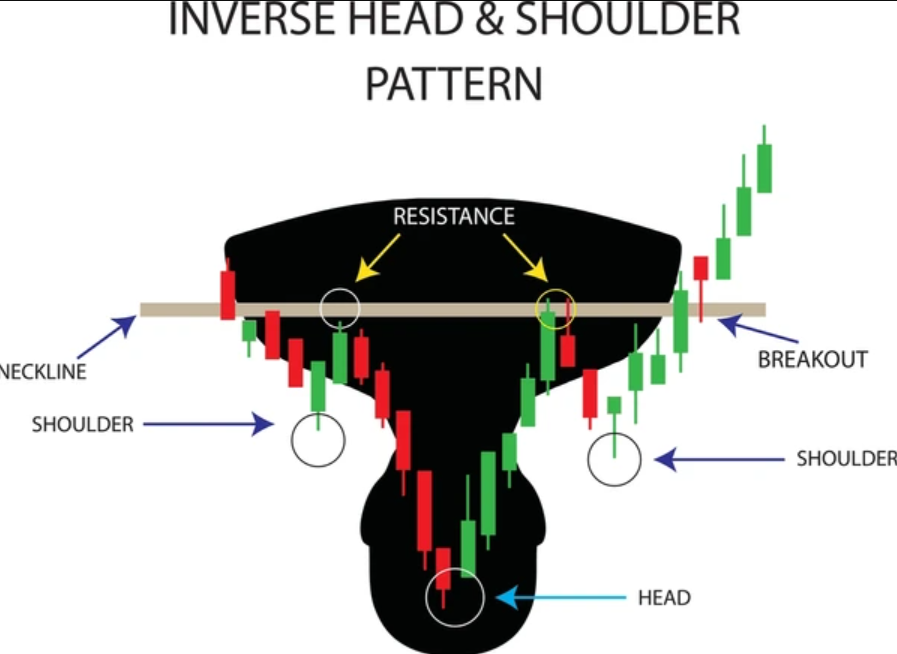
The head and shoulders pattern is a popular reversal chart pattern that signals a potential trend change from bullish to bearish. It is characterised by three peaks: the middle peak, known as the "head," is the highest, while the two outer peaks, called the "shoulders," are lower and roughly equal in height. This pattern is complete when the price breaks below the support level, known as the neckline, which connects the two shoulders.
8. Ascending and Descending Staircase
Ascending and descending staircases are probably the most basic chart patterns. But they're still important to know if you're interested in identifying and trading trends.
Take a look at any market, and you'll notice that price action is rarely linear. Even in strong uptrends and downtrends, you'll see some movement against the prevailing momentum.
In an ascending staircase, a market is moving upwards. While it retraces occasionally, it is still hitting higher highs and the lows are getting higher too. This is what a bull market generally looks like, and traders will consider going long until the uptrend comes to an end.
The dips in the trend can even provide useful buying opportunities, enabling you to get in on the rally at a discount.
When markets form lower lows and lower highs, this can be considered a downtrend and forms a descending staircase, which is one of the bearish patterns traders look for. In this phase, traders would consider trading on the short side of the market. And in a downtrend, a trader could use the mini rallies that go against the bear run as opportunities to sell.
9. Triple Top and Triple Bottom
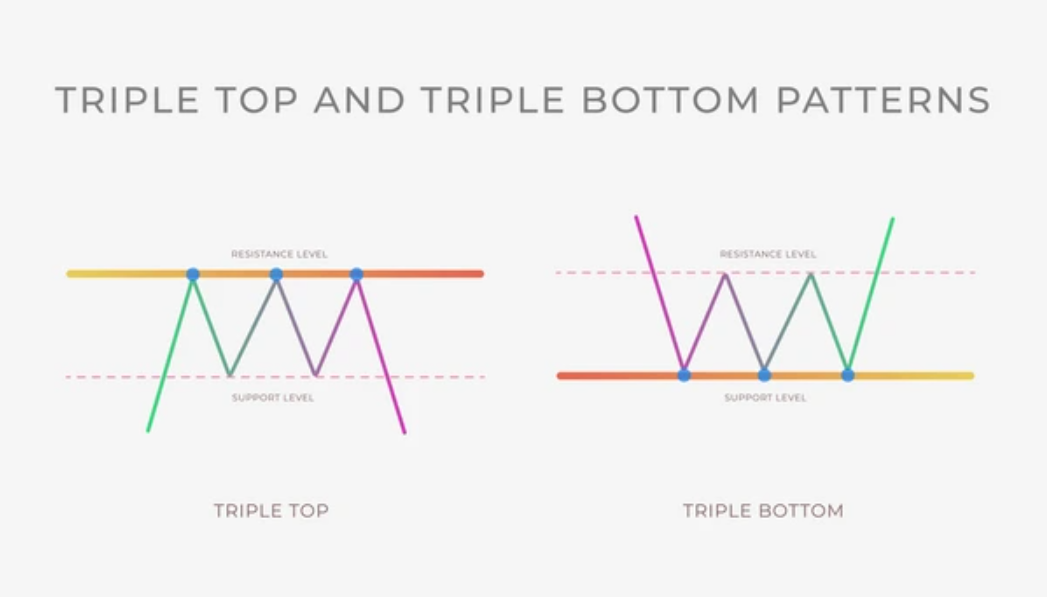
The triple top and triple bottom patterns are variations of the double top and double bottom but with an extra peak or trough.
Triple Top: This pattern occurs when the price reaches three similar highs but fails to break resistance. It signals a potential bearish reversal, meaning the price may decline after the third peak.
Triple Bottom: This is the opposite, forming after three similar lows. It suggests that the price has strong support and may start an uptrend after the third trough.
Traders usually wait for confirmation by observing a breakout below the support level (triple top) or above the resistance level (triple bottom).
10. Cup and Handle
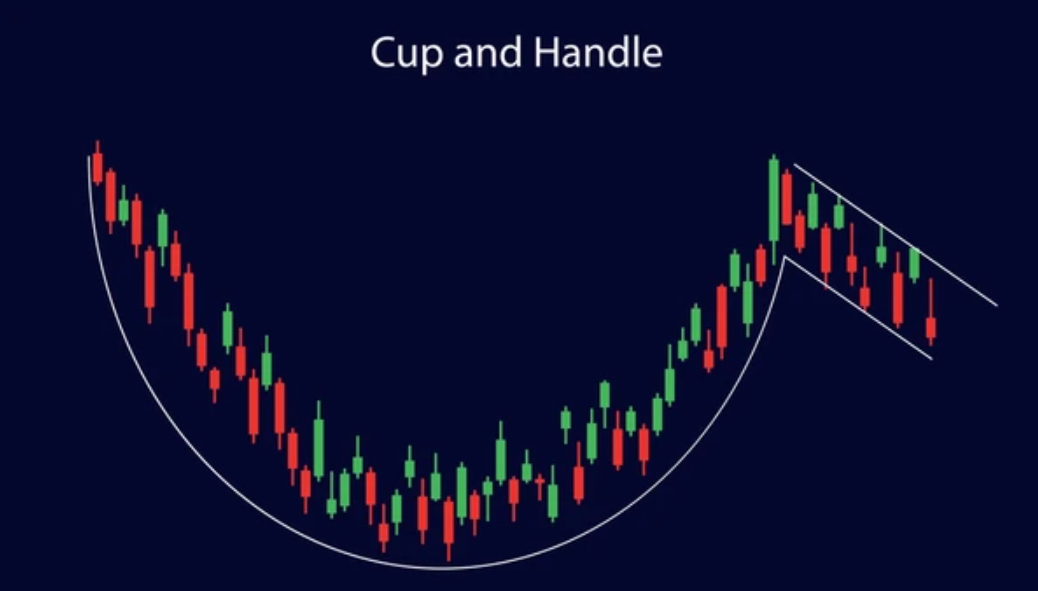
The cup and handle is a bullish continuation pattern that resembles a teacup shape.
The cup forms as the price gradually declines and then rises, creating a rounded bottom.
The handle appears as a slight downward drift following the cup.
Once the price breaks above the resistance formed by the cup's rim, it signals a potential upward trend. Traders use this pattern to identify buying opportunities.
11. Rectangle Pattern
The rectangle pattern occurs when the price consolidates between a horizontal support and resistance level.
Bullish Rectangle: If the price breaks above the resistance level, it signals a continuation of an uptrend.
Bearish Rectangle: If the price breaks below the support level, it signals a continuation of a downtrend.
This pattern shows a period of market indecision before a breakout occurs in either direction. Traders often wait for confirmation before making a trade.
Chart Pattern Analysis
Chart pattern analysis is a crucial aspect of technical analysis that involves identifying and interpreting chart patterns to predict future price movements. By studying these patterns, traders can gain valuable insights into market sentiment and potential price directions. Chart patterns can help identify trends, reversals, and continuations, providing traders with a framework to make informed decisions about buying and selling.
Technical analysis relies heavily on chart pattern analysis because it offers a visual representation of market psychology. By recognising patterns that have historically led to specific outcomes, traders can anticipate similar movements in the future. This predictive power makes chart pattern analysis an essential tool for anyone looking to navigate the complexities of the financial markets.
Identifying Chart Patterns
Identifying chart patterns requires a combination of technical analysis skills and market knowledge. Traders need to be adept at recognising various patterns, such as head and shoulders, double tops, and triangles, and understanding their implications for future price movements. This process often involves using technical indicators like trend lines, support and resistance levels, and candlestick patterns to confirm the presence of a chart pattern.
For instance, trend lines can help delineate the boundaries of a pattern, while support and resistance levels can indicate potential breakout points. Candlestick patterns can provide additional confirmation of a pattern's validity. By mastering these tools, traders can enhance their ability to spot chart patterns and make more informed trading decisions.
Trading with Chart Patterns
Trading with chart patterns involves using identified patterns to make strategic buying and selling decisions. Traders can leverage chart patterns to pinpoint potential trend reversals, continuations, and breakouts. By combining chart patterns with other technical indicators and fundamental analysis, traders can increase the accuracy of their trades and manage risk more effectively.
For example, if a trader identifies a head and shoulders pattern, they might prepare to short the market once the price breaks below the neckline. Conversely, recognising a bullish flag pattern could prompt a trader to go long after the breakout. The key is to use chart patterns as part of a broader trading strategy that incorporates multiple sources of information.
Managing Risk with Chart Patterns
Managing risk with chart patterns involves using identified patterns to set stop-loss orders and limit potential losses. By recognising potential support and resistance levels within a chart pattern, traders can strategically place stop-loss orders to protect their positions. This approach helps minimise losses if the market moves against their expectations.
For instance, if a trader identifies a descending triangle, they might set a stop-loss order just above the resistance level to limit losses in case of an unexpected breakout. By managing risk effectively, traders can safeguard their capital and maximise gains, ensuring a more sustainable trading strategy over the long term.
Disclaimer: This material is for general information purposes only and is not intended as (and should not be considered to be) financial, investment or other advice on which reliance should be placed. No opinion given in the material constitutes a recommendation by EBC or the author that any particular investment, security, transaction or investment strategy is suitable for any specific person.


