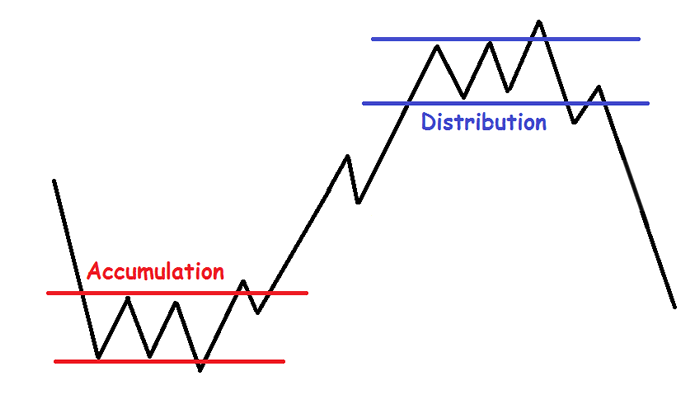
In the world of technical analysis, understanding the flow of money into and out of a security is vital for making informed trading decisions. The Accumulation Distribution Line (ADL) is a popular volume-based indicator that provides traders with insights into whether an asset is being accumulated (bought) or distributed (sold).
By combining price and volume data, the ADL helps confirm trends, detect divergences, and anticipate potential reversals in the market.
What Is the Accumulation Distribution Line?

The Accumulation Distribution Line, developed by Marc Chaikin, is a cumulative indicator that measures the underlying buying and selling pressure of a security.
Unlike some indicators that focus solely on price or volume, the ADL integrates both, offering a more comprehensive view of market sentiment. When the ADL rises, it signals accumulation — meaning buyers are in control. When it falls, it indicates distribution, with sellers dominating the market.
How Is the Accumulation Distribution Line Calculated?
The ADL calculation involves three main steps:
1. Calculate the Money Flow Multiplier (MFM):
((Close value – low value) – (high value – close value)) / (high value – low value)
The MFM ranges from -1 to +1. If the closing price is near the high of the period, the multiplier is positive, suggesting strong buying pressure. If the close is near the low, the multiplier is negative, indicating selling pressure.
2. Calculate the Money Flow Volume (MFV):
MFV = MFM × Volume
This step weights the price position within the range by the period's volume, giving more significance to moves on higher volume.
3. Calculate the ADL:
Current ADL = Previous ADL + MFV
The ADL is a running total, which means it accumulates the Money Flow Volume over time, reflecting the cumulative effect of buying and selling.
Interpreting the Accumulation Distribution Line
The direction of the ADL is more important than its absolute value. Traders focus on whether the line is rising or falling and how it relates to price action.
Trend Confirmation
If both the price and ADL are making higher highs and higher lows, it confirms an uptrend. When both are making lower highs and lower lows, it confirms a downtrend. This alignment gives traders confidence that the trend is strong and likely to continue.
Divergence Signals
One of the most valuable uses of the ADL is spotting divergences:
Bullish Divergence: Price makes new lows, but the ADL forms higher lows. This suggests selling pressure is weakening and a bullish reversal may be on the horizon.
Bearish Divergence: Price makes new highs, but the ADL forms lower highs. This indicates buying pressure is waning and a bearish reversal could follow.
These divergences often precede significant turning points in the market, giving traders an early warning to adjust their positions.
Breakout Warnings
During a trading range, a rising ADL can signal accumulation and a potential upward breakout. Conversely, a falling ADL during a range may warn of an impending downward breakout.
Watching the ADL in sideways markets can help traders anticipate which direction the next move might take.
Practical Example
Imagine a share with a high of 200p, a low of 180p, a close of 195p, and a volume of 10,000. The Money Flow Multiplier would be:
MFM =
(195 − 180) − (200 − 195) = 15 - 5 = 10 = 0.5
----------------------------------- ------- ----
200 − 180 20 20
The Money Flow Volume is:
0.5 × 10,000 = 5,000
If the previous day's ADL was 20,000, the new ADL would be:
20,000+5,000=25,000
A rising ADL like this suggests accumulation and supports a bullish view.
Strengths and Limitations
Strengths:
Combines price and volume for a deeper market view
Confirms trends and warns of reversals via divergence
Useful for all timeframes and asset classes
Limitations:
Can give false signals in choppy or low-volume markets
Not predictive — should be used with other indicators for confirmation
Sensitive to large price gaps or abnormal volume spikes
Tips for Using the ADL Effectively
Combine the ADL with moving averages or momentum indicators for stronger signals.
Watch for divergence between price and the ADL to catch potential reversals early.
Use the ADL to confirm breakout strength in sideways markets.
Always practise sound risk management, especially when trading on divergence signals.
Conclusion
The Accumulation Distribution Line is a valuable tool for traders seeking to understand the real flow of money behind price movements. By combining price and volume, the ADL helps confirm trends, spot divergences, and anticipate breakouts or reversals.
For best results, use the ADL alongside other technical indicators and maintain disciplined risk management.
Disclaimer: This material is for general information purposes only and is not intended as (and should not be considered to be) financial, investment or other advice on which reliance should be placed. No opinion given in the material constitutes a recommendation by EBC or the author that any particular investment, security, transaction or investment strategy is suitable for any specific person.


