In recent years,the Japanese stock market has been on a continuous upward trend,generating widespread interest and investment enthusiasm. This boom has attracted the attention of famous investment gurus such as Warren Buffett,who have turned their investment goals toward the Japanese market. As one of the largest economies in Asia,Japan's stock market is highly regarded for its dynamism and potential. In this bustling investment scene,the Nikkei Index,as a representative indicator of the Japanese stock market,has become the focus of investor research and attention. In this article,we will discuss the Nikkei Index and its importance in this regard.

What is Nikkei?
Its full name is Nikkei Average Stock Price Index,also known as Nikkei 225. It is a major stock index in the Japanese stock market. It is a weighted average index compiled by the Tokyo Stock Exchange to measure changes in the prices of a basket of stocks in the Japanese stock market.
Nikkei in its name refers to the abbreviation of Nihon Keizai Shimbun (Nippon Keizai Shimbun), which is the top-ranked financial newspaper in Japan. At the same time, Nikkei is often used to refer to the Nikkei Average Index published by the organization,which is one of the main stock price indexes of the Japanese stock market and is used to measure the overall performance of the Japanese stock market.
The Nikkei 225 is a formula that calculates the average stock price of 225 representative Japanese companies listed on the Tokyo Stock Exchange out of more than 2.000 companies listed on the Tokyo Stock Exchange. It is considered one of the most important indicators of the overall performance of the Japanese stock market,similar to the CSI 300 for the Chinese stock market and the S&P 500 for the U.S. stock market.
These are indices of companies from a variety of industry sectors,calculated using a formula that takes data from headline Market Capitalization companies that meet certain criteria. The member companies of these indices are ranked according to various factors such as performance,volume, turnover, and market capitalization of the listed companies and are regularly replaced.
The Nikkei has its own peculiarities compared to other world stock indices. First of all,it is not composed of clear criteria, such as taking the headline companies,but rather takes into account the average and balance of the various industries in which the constituent companies are located.
For example,just because the tech sector is doing particularly well these days,it doesn't mean that tech companies make up the majority of the index. Rather,it has a certain percentage of whatever industry it is in. For example, in industrial,chemical,construction,etc., whether the industry is in an uptrend or a sunset industry,the companies in these industries will be able to get a certain percentage.
Secondly,it is also important to note that the companies in the Nikkei Index are somewhat biased because the Nikkei was created in 1970. before the Tokyo Stock Exchange and the Osaka Stock Exchange in the Kansai region were merged. So some of the companies that were listed on the Osaka Stock Exchange at the time did not make it into the Nikkei 225.For example,we are familiar with Nintendo, Nidec, and so on.
In addition,the current criteria for selecting Nikkei constituents were established in 2000. and in order to maintain the stability and consistency of the index,it was stipulated that only one or two companies would be replaced each year based on a combination of considerations. This means that the Nikkei does not necessarily reflect rapidly growing industries and companies,or sunrise and sunset industries.
Finally, it,like the S&P 500. has a very unbalanced weighting of companies in it. Same with the S&P 500's #1 and #2-ranked weights, Apple and Microsoft,which together are weighted at over 11%. The Nikkei's top-ranked companies are also very heavily weighted in the overall index.
For example,the first is fast retelling, and the second is selling. This company weighed 12.6%. Ranked second by Softbank,which invested in Alibaba,the company is in the circle of the Nikkei and accounts for 7.5%. The entire Nikkei, 225 companies ranked in the top 15 of the weight, accounted for more than 50%, and the top 5 companies accounted for more than 20%. That means the share price of these 5 big headline companies can easily affect the Nikkei 225 if their share prices go up or down.
As the main reference index for the Japanese stock market,the Nikkei not only provides investors with an important tool to participate in the Japanese stock market but also reflects the overall condition of the Japanese economy. Its movements have a significant impact on both domestic and foreign investors and economic policymakers,and therefore the government, regulators, and market participants closely monitor its changes to maintain market stability and investor confidence.
Nikkei 225 Top 10 Weights
|
Company
|
Nikkei Industry
|
Weight(%)
|
|
Fast Retailing Co-, Ltd.
|
Classification |
9.9 |
|
Softbank Group Corp.
|
Retail |
4.35 |
|
Tokyo Electron Ltd.
|
Communications |
3.64 |
|
Fanuc Corp.
|
Electric Machinery |
3.1 |
|
KDDI Corp.
|
Electric Machinery |
2.97 |
|
Terumo Corp.
|
Communications |
2.37 |
|
Daikin Industries, Ltd.
|
Precision Instruments |
2.35 |
|
Kyocera Corp.
|
Machinery |
2.28 |
|
TDK Corp.
|
Electric Machinery |
1.89 |
|
Advantest Corp.
|
Electric Machinery |
1.88 |
Nikkei Market Trend
The Nikkei is one of the major stock indices of the Japanese stock market,compiled and published by the Nihon Keizai Shimbun. The index represents an important reference for the Japanese economy and financial markets,recording the long-term development and changes in the Japanese stock market,and is widely used by investors, analysts, and economists to assess the overall performance of the Japanese stock market.
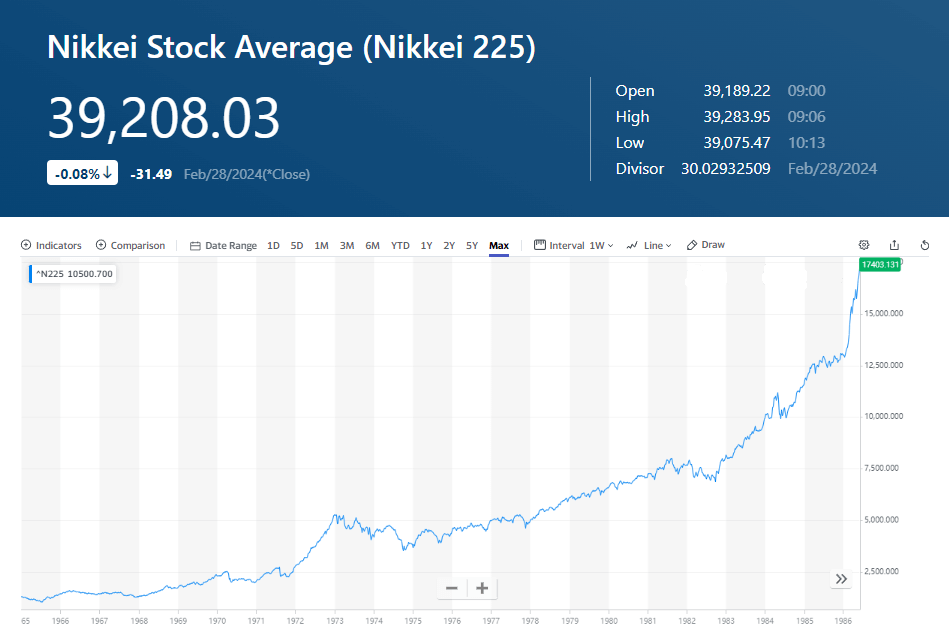
The history of the Nikkei 255 Index dates back to May 16. 1970. when it was benchmarked at 1.000 points. Over time,the Nikkei has experienced various market cycles,economic fluctuations, and historical events,and its value has fluctuated and changed. In particular,in the early 1990s,the Nikkei experienced a period of rapid growth,reaching an all-time high of 38.915.87 points.
Since then,however,the Japanese stock market has also experienced a number of challenges,including recession,financial crises, and other factors that have caused the Nikkei to fall sharply during certain periods. Nonetheless,it remains one of the world's most important stock indices,attracting the attention and participation of global investors.
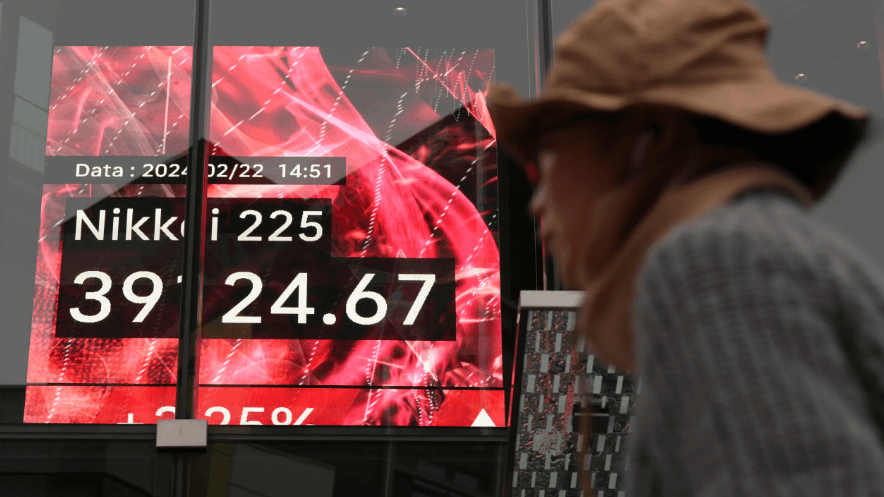
And in recent years,the Nikkei's gains have begun to rise,especially yesterday, when it surpassed a 34-year closing high of 39.400 points. The sudden rise in the Japanese stock market,which has been in the doldrums for more than 30 years,is mainly due to good economic data,such as GDP growth,improved employment data,rising consumer confidence,etc., which boosted investor confidence in the economic outlook,thus driving the stock market up.
The government's favorable policies,market reform initiatives, or monetary policy easing are also good remedies to stimulate the stock market and prompt investors to increase their demand for buying Japanese stocks. As well,positive factors such as earnings growth,improved performance, or business expansion of Japanese companies can drive up stock prices,thus boosting the Nikkei 255.
At the same time,the positive market sentiment in major global stock markets and the increased confidence of international investors in the Japanese stock market are also important reasons for driving the Nikkei up. According to survey data,the Tokyo Stock Exchange market stock trading transactions amounted to 70% of the amount of money in fact are overseas investors,and these overseas investors of a certain extent can be said to sway the Nikkei to rise and fall.
The depreciation of the Japanese currency (yen) has also stimulated the competitiveness of export enterprises and boosted the Japanese stock market,which in turn has pushed the Nikkei up. At the same time,external factors such as the stabilization of the geopolitical situation,the improvement of the international trade environment,and the increase in the price of Crude Oil may also have a positive impact on the Japanese stock market,pushing the Nikkei 255 higher.
However,although this excessive rise has brought heat to the market,some investors are concerned about whether it is an economic bubble. Therefore,some sources pointed out that the Bank of Japan is considering withdrawing from the compound interest rate policy because of signs that Japan is coming out of deflation. If the Bank of Japan raises interest rates,the yen may appreciate sharply, weakening the competitiveness of Japanese exporters,which will have a certain impact on the Japanese stock market.
At the same time, because the Nikkei 225 index and the Dow Jones Industrial Average are share price-weighted indexes,unlike the general index that sets weights by market value,the preparation rules are more eccentric. For example, in the Nikkei 225 index, the largest weighted company is Sun Sales, which, if ranked by market capitalization, is in 7th place. Toyota has the largest market capitalization in the Nikkei 225 index but is ranked in 15th place. So now the Nikkei's high level does not represent the entire Japanese stock market and can also be said to be relatively detached from the real economy.
That said,investing in the Nikkei nowadays can be risky because the Nikkei's market may change for the reasons mentioned above. Therefore,investing in the Nikkei 255 Index and its derivative financial products requires a clearer market direction and investment strategy.

Nikkei Average Futures
Often referred to as Nikkei Average Futures in Japan,they are financial derivatives traded on exchanges whose value depends on the movement of the Nikkei 225 index in the Japanese stock market. The price of a futures contract fluctuates with the Nikkei 255 because the value of a futures contract is determined by the movement of the Nikkei.
In general,the price of Nikkei futures is affected by the movement of the Nikkei 255. When investors expect the Nikkei 255 to rise in the future,they may buy Nikkei futures contracts,driving futures prices up; conversely,when they expect the Nikkei 255 to fall,they may sell futures contracts,causing futures prices to fall.
In other words,there is a close relationship between the Nikkei futures and the Nikkei 255. and the dynamics between them affect trading and investment activities in the Japanese stock market. In fact,this can be clearly seen when the K charts of the two are put together. Their K-line trends are usually highly correlated.
Though they are both important tools for reflecting the overall performance of the Japanese stock market,there may be some short-term price differences between the two due to differences in their trading mechanisms and market participants. For example,due to the fact that the futures market has its own trading mechanism and liquidity,as well as the different needs and trading behaviors of its participants,futures prices may deviate from spot index prices to some extent.
Nonetheless,investors can use Nikkei futures to trade and invest in Nikkei 255 and can buy or sell futures contracts to speculate on or hedge the future movements of Nikkei 255. Arbitrage trading can also be conducted by utilizing the price difference between the Nikkei futures and spot markets.By trading between the futures market and the spot market,investors can utilize the price difference to earn arbitrage income.
Investors can buy or sell Nikkei futures through futures contracts for profit or risk. These futures contracts are usually traded on futures exchanges, and their trading hours and rules may vary. For example,Nikkei futures trading hours are usually divided into two periods:day trading and night trading.
Daytime trading usually begins at 8:45 a.m. and ends at 3:15 p.m., similar to the trading hours of the Tokyo stock market. Night trading,on the other hand,usually starts at 5:30 p.m. and lasts until 7:00 a.m. or 8:30 a.m. the following day. Night trading hours usually provide trading opportunities for investors in the U.S. and other time zones.
Moreover,the rules for trading Nikkei futures usually follow those of the exchanges and are regulated by regulatory agencies. In Nikkei futures trading,traders can use different types of orders, such as market orders and limit orders. There are also transaction fees to be paid and margins to be paid, depending on the position.
Also, the exchange may set price fluctuation limits (stops) and daily maximum fluctuation limits to control market volatility. It is also important to note that upon the expiration of a futures contract,delivery is usually made by cash settlement rather than physical delivery.
Overall,the Nikkei futures market provides a platform for price discovery by reflecting investorsexpectations of the future movements of the Nikkei through buying and selling transactions, which helps investors more accurately assess market risk. It is also important to note that when trading Nikkei futures,investors should understand and comply with the relevant regulations and trading systems of the exchange and conduct trading operations with caution.
Nikkei futures contract trading month
|
Year
|
March contract
|
June Contract
|
September contract
|
December contract
|
|
2023
|
|
|
|
● |
|
2024
|
● |
● |
● |
● |
|
2025
|
● |
● |
|
● |
|
2026
|
|
● |
|
● |
|
2027
|
|
● |
|
● |
|
2028
|
|
● |
|
● |
|
2029
|
|
● |
|
● |
|
2030
|
|
● |
|
● |
|
2031
|
|
● |
|
|
Disclaimer:This material is for general information purposes only and is not intended as (and should not be considered to be) financial, investment, or other advice on which reliance should be placed. No opinion given in the material constitutes a recommendation by EBC or the author that any particular investment,security, transaction, or investment strategy is suitable for any specific person.


