In the world of commodities and equities, few instruments blend tradition and innovation quite like the XAU Index. Much like a compass for precious metal equities, the XAU Index offers traders and long-term investors a gauge of market performance in gold and silver mining companies.
To understand its current relevance, we need to look back at its origins, development and changing influence over the years.
What Is the XAU Index?

The XAU Index, officially known as the Philadelphia Gold and Silver Index, tracks the performance of leading companies involved in the mining of precious metals. It includes firms primarily focused on gold and silver exploration, extraction and production. Maintained by Nasdaq, it serves as a benchmark for those investing in this segment of the stock market.
Unlike the spot price of gold or silver, the XAU Index reflects the performance of mining equities rather than the price of the physical commodities themselves. As a result, the index may show different trends than gold or silver prices alone, often influenced by operational efficiency, geopolitical factors and investor sentiment around mining stocks.
Origins and Early Performance
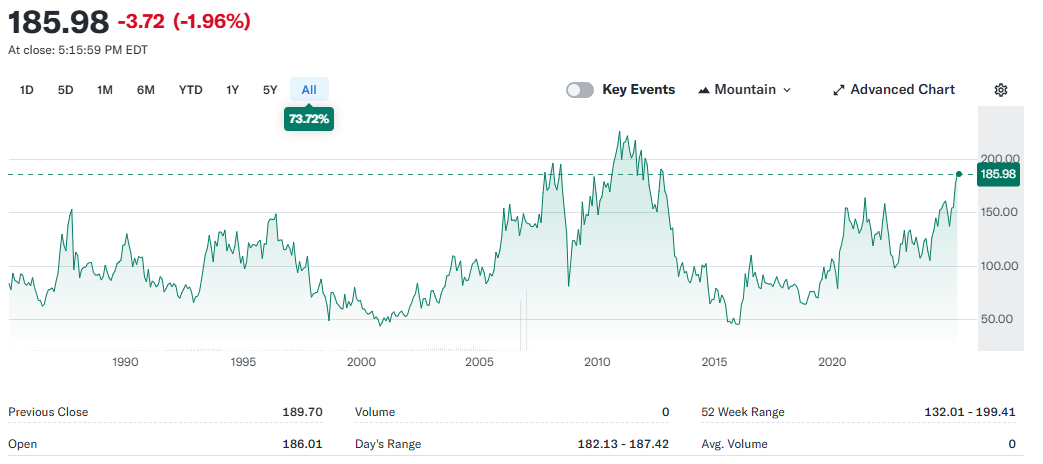
The XAU Index was introduced in 1983 by the Philadelphia Stock Exchange. At the time, it included just nine major mining firms. Its introduction aimed to provide investors with a consolidated view of the sector's performance rather than tracking individual stocks.
In its early years, the index was particularly sensitive to global economic shifts. Political tensions, inflation worries and interest rate changes all played a role in how mining shares performed. During periods of rising gold prices, the XAU Index typically surged as investors flocked to mining stocks for leveraged exposure to the commodity.
XAU Index in the 1990s and Early 2000s
The 1990s saw some interesting developments. As gold prices experienced prolonged periods of stagnation, the XAU Index also showed subdued growth. However, this era helped distinguish the XAU Index from physical gold. Investors noticed that mining stocks could still move independently, sometimes outperforming the underlying metal due to operational expansions or mergers.
The early 2000s marked a turning point. As gold entered a prolonged bull market, driven by geopolitical instability and weakening fiat currencies, the XAU Index rose significantly. Investors began paying closer attention to mining stocks as vehicles for capital appreciation, not just safe havens.
Impact of Financial Crises and Market Cycles
The 2008 financial crisis had a dramatic impact on global markets, and the XAU Index was no exception. Despite gold's reputation as a safe haven, mining stocks were caught in the broader equity market selloff. The XAU Index declined sharply alongside other major indices, reminding investors that mining equities carry their own risks.
However, in the years that followed, the XAU Index rebounded strongly. Gold prices soared amid quantitative easing and low interest rates, and so did the share prices of gold and silver producers. The index became a popular reference for those looking to trade on gold trends without direct exposure to the physical asset.
Comparing the XAU Index to Other Benchmarks

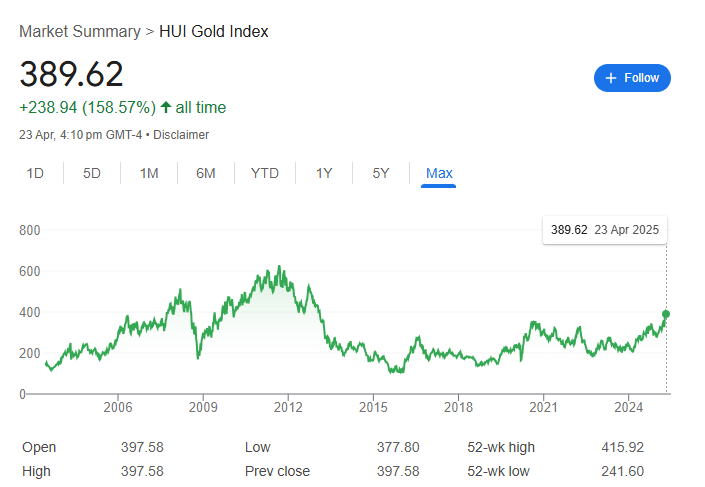
While the XAU Index remains a trusted benchmark, it is often compared to other indices like the NYSE Arca Gold BUGS Index (HUI). The key difference lies in methodology. The XAU Index includes both hedged and unhedged mining companies, while HUI focuses on unhedged producers. This makes the XAU Index slightly more conservative in volatile conditions.
Investors may also compare the XAU Index to the price of gold itself. During bullish gold markets, the index often outperforms the metal due to the operational leverage of mining firms. However, in declining markets, the index may underperform, reflecting the compounded risks involved in mining operations.
Recent Trends and Digital Evolution
In recent years, the XAU Index has evolved along with broader market technology. With algorithmic trading and ETF popularity on the rise, the index now plays a more dynamic role in passive investing strategies. Products like gold mining ETFs often track or mirror the performance of the XAU Index, making it more accessible to retail investors.
As environmental, social and governance (ESG) considerations gain traction, the composition of the index could see future changes. Investors are increasingly looking at how mining companies manage their environmental footprint and labour practices, which could affect valuations and index weighting.
How to Use the XAU Index in Trading Strategies
Traders and portfolio managers use the XAU Index in various ways. It can be a helpful tool in technical analysis, especially when looking for divergence from gold spot prices. If the XAU Index rises while gold prices remain flat, it could indicate a bullish sentiment in the sector.
The index is also used in options and futures trading, where investors seek leveraged exposure or hedging opportunities. Some even use the XAU Index as a contrarian indicator, betting against overextended sentiment during gold rushes.
Limitations
Despite its benefits, the XAU Index has limitations. Its focus on North American companies may exclude important international players. Also, being an equity-based index, it can be influenced by factors unrelated to gold and silver prices, such as tax policies, political risks or labour strikes.
For accurate analysis, traders often use the XAU Index in conjunction with other indicators, such as volume, momentum and fundamental company data. This approach gives a fuller picture of where the sector might be heading.
Future Outlook of the XAU Index
As global markets remain volatile and central banks reconsider monetary policies, interest in gold-related assets persists. The XAU Index is likely to remain a key reference point for those watching the performance of gold and silver mining equities.
Whether you're an institutional investor or a retail trader, understanding the historical patterns and mechanics of the XAU Index can enhance your market decisions. Its evolution over the years shows how closely financial instruments can mirror broader economic narratives.
Disclaimer: This material is for general information purposes only and is not intended as (and should not be considered to be) financial, investment or other advice on which reliance should be placed. No opinion given in the material constitutes a recommendation by EBC or the author that any particular investment, security, transaction or investment strategy is suitable for any specific person.


