Published on: 2025-04-24
Updated on: 2025-10-02
When comparing Camarilla Pivots and Fibonacci Retracements, precision depends on market context. Each excels under different conditions.
Camarilla Pivot offers sharper levels in range-bound intraday markets, while Fibonacci consistently highlights pullbacks in trending moves.
The key is not choosing one over the other but understanding which market environment favors which method.
In trading, “precision” does not mean exact predictions. It refers to how closely projected levels align with actual turning points, how frequently those levels filter out false signals, and how consistently they work across timeframes.
By that definition, both Camarilla and Fibonacci can be precise if applied correctly in the right conditions.

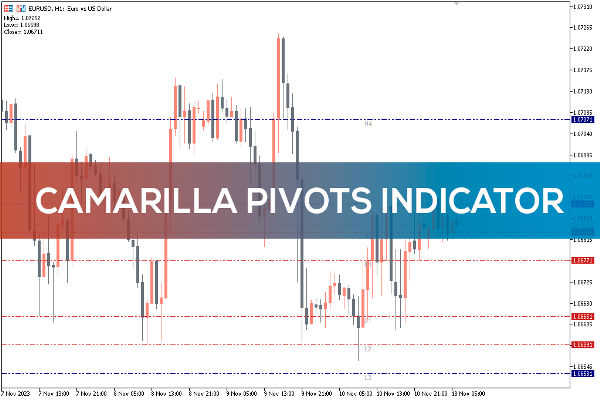
Introduced in the 1990s, Camarilla Pivots use the previous day’s high, low, and close to generate a series of levels positioned above and below the current price, helping traders anticipate where the market might reverse or stall.
Camarilla pivots are recalculated each day using the prior session’s price data.
This produces a tight grid of intraday levels, often catching reversals in range-bound markets with impressive accuracy.
For scalpers and day traders, Camarilla pivots provide structure for rapid decisions.
However, the same density of levels that feels precise in sideways markets becomes noisy in trending environments, where price tends to cut through them quickly.
Their strength lies in the short-term, not in long swings.

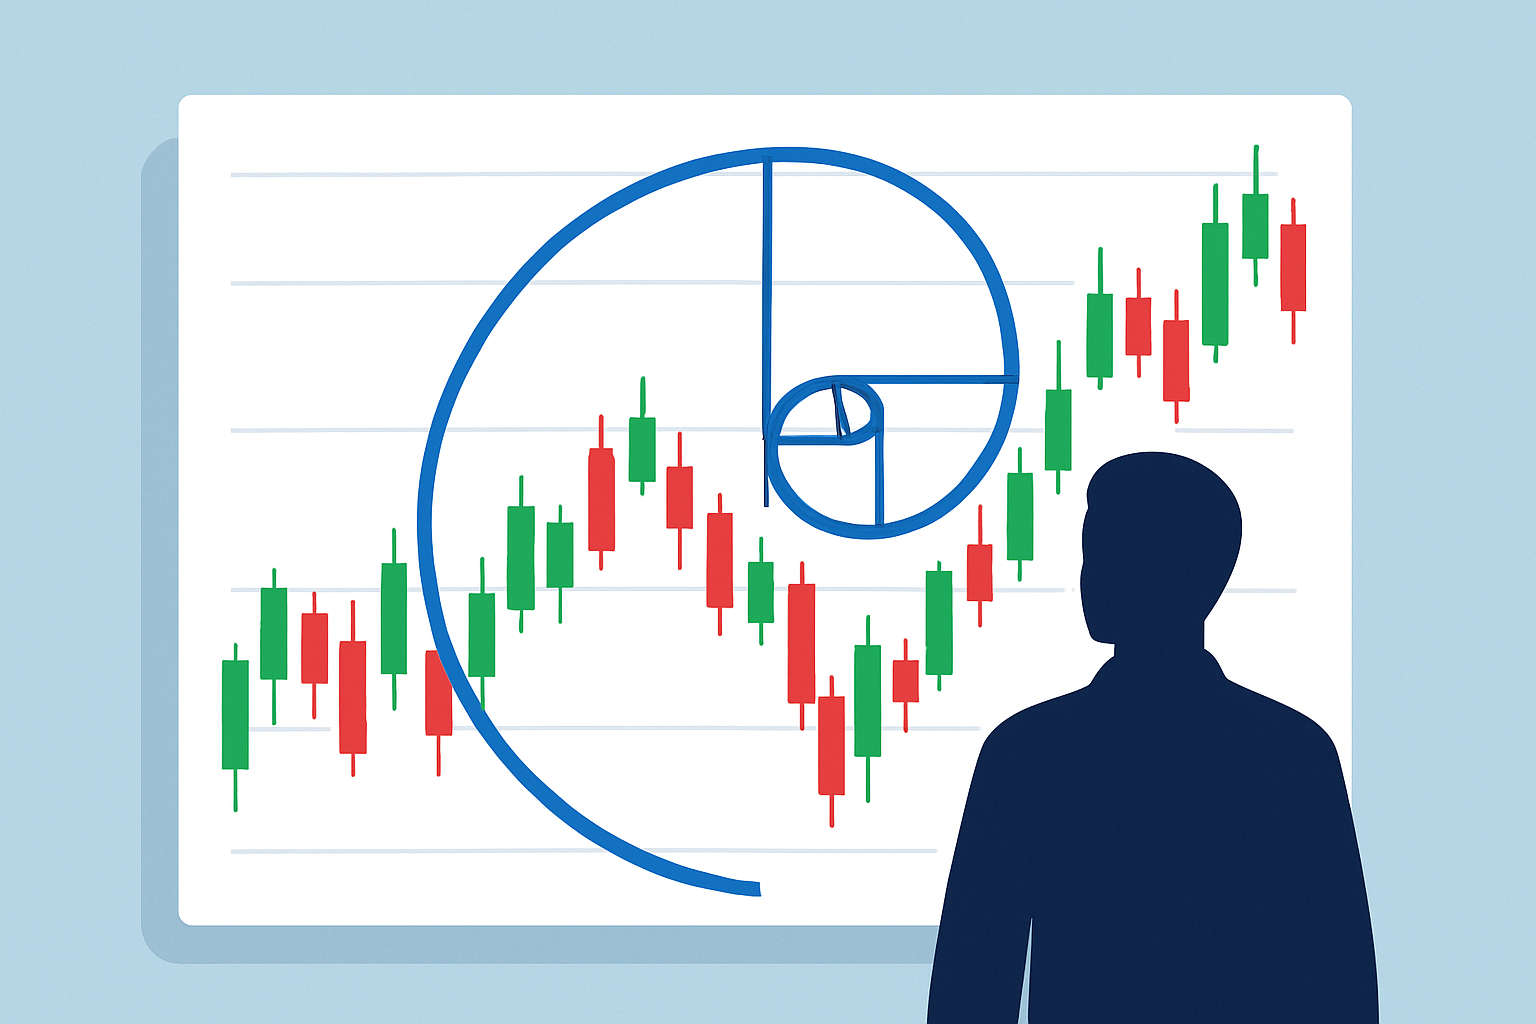
Fibonacci retracements work differently from pivot points.
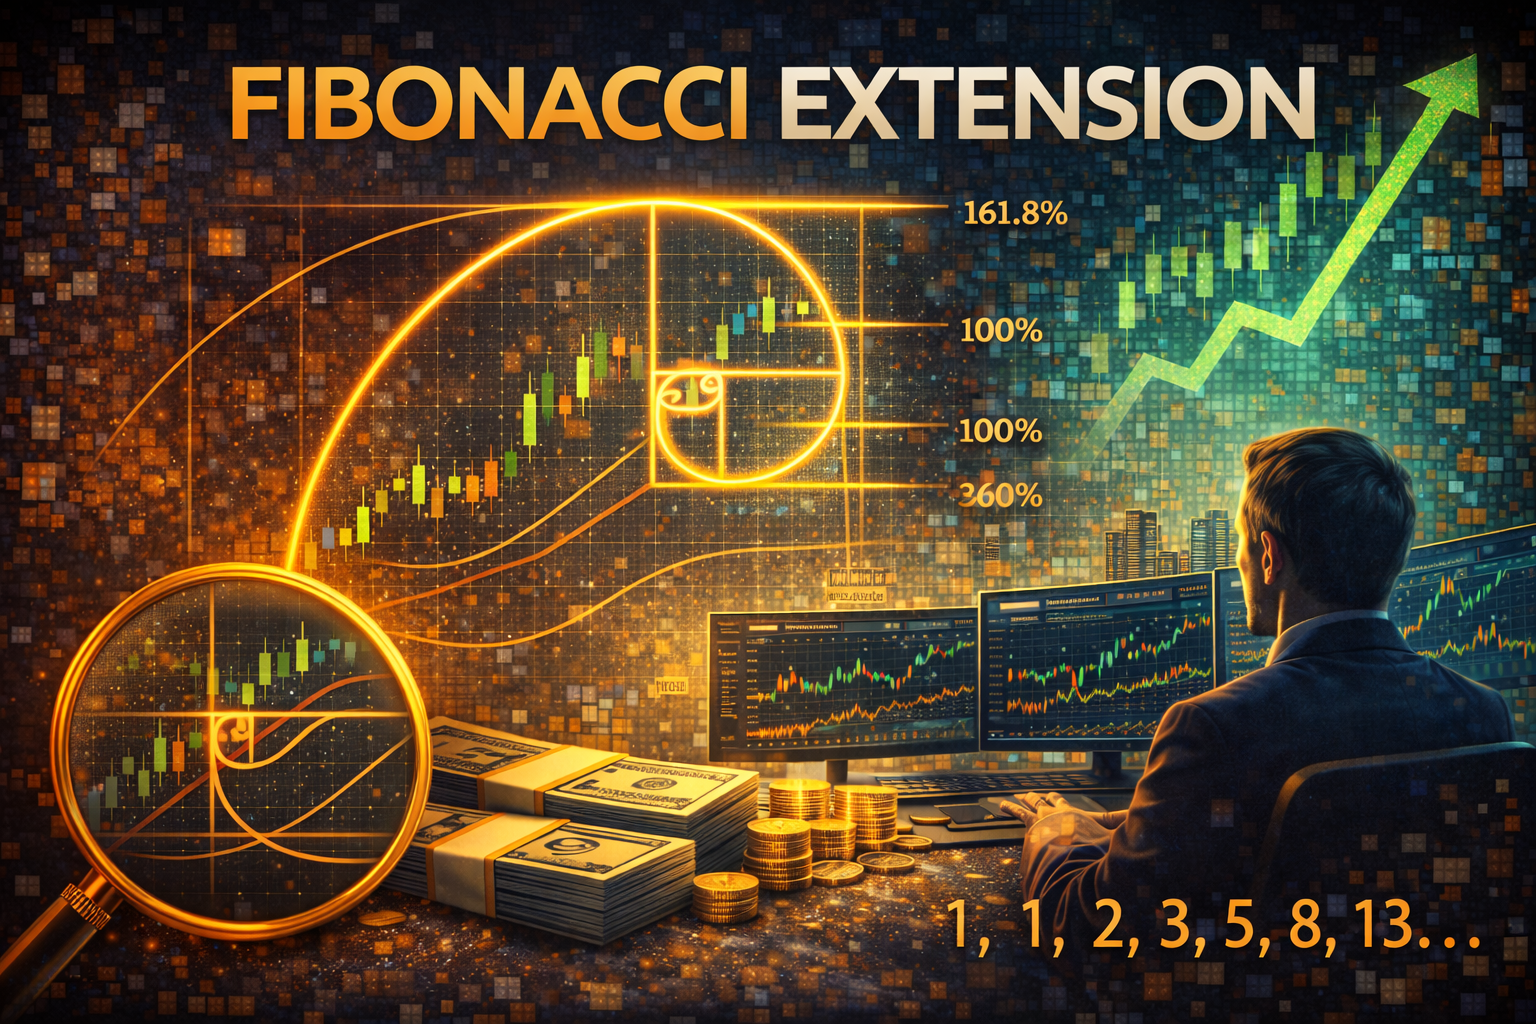
They are one of the most popular tools in technical analysis, derived from ratios in the Fibonacci sequence. Instead of recalculating daily, they remain static until a new swing high or low is chosen.
The key Fibonacci levels 23.6%, 38.2%, 50%, 61.8%, and 100% — act as potential turning points. These percentages mark areas where price is more likely to pause, retrace, or reverse within an ongoing trend.
Traders rely on these levels to:
Identify potential support and resistance zones.
Spot pullbacks in an established trend.
Refine entry and exit strategies by aligning trades with retracement points.
Because Fibonacci levels are widely recognized, they often become self-fulfilling markers — many traders watch the same zones, increasing the chance of a reaction when price reaches them.
However, their weakness is that they work best in trending markets and can produce false signals in sideways conditions.
Each method has strengths and weaknesses depending on market conditions. Here are the direct comparisons between Camarilla Pivot and Fibonacci:
| Aspect | Camarilla Pivots | Fibonacci Retracements |
|---|---|---|
| Market Fit | Strong in range-bound, sideways markets | Strong in trending markets with pullbacks |
| Timeframe Focus | Intraday and very short-term | Multi-timeframe, from minutes to weekly |
| Strengths | Adaptive daily levels; sharp for quick reversals | Clear retracement zones; stable framework |
| Weaknesses | Clutter in trends; short-lived relevance | Subjective swing selection; false crowd reactions |
Precision is not embedded in either tool.

Camarilla Pivots tend to appear more precise when price action is range-bound or choppy, providing sharper reversal levels for short-term traders. On the other hand, Fibonacci Retracements often feel more reliable during strong trending moves, where pullbacks respect key retracement ratios.
Both tools can lose effectiveness if used in the wrong context. Camarilla levels often break down in momentum-driven breakouts, while Fibonacci can create misleading signals in sideways, unpredictable ranges.
The real question isn’t “Which is better?” but rather “Which market condition am I trading right now?” Matching the tool to the environment is what delivers true precision.
The most practical approach is to view them as complementary.
Both Camarilla Pivots and Fibonacci levels are effective on their own, but combining them can offer a more complete view of the market.
Pro Tip: Use Camarilla Pivots for intraday setups and Fibonacci for swing trades. When both align, the probability of a reversal increases.
Camarilla Pivots help identify short-term support and resistance, while Fibonacci retracements highlight potential pullbacks within a trend. When a price approaches a Fibonacci level that also aligns with a Camarilla Pivot, the signal becomes stronger, giving traders more confidence in their decisions.
1. Are Camarilla Pivots more accurate than Fibonacci Retracements?
Neither tool is universally more accurate. Camarilla Pivots tend to work best in range-bound, intraday markets, while Fibonacci Retracements are more effective in trending conditions.
Accuracy depends on applying the right tool in the right environment.
2. Can I use Fibonacci Retracements and Camarilla Pivots together?
Yes. Many traders combine both methods for stronger confirmation. When a Fibonacci retracement level aligns with a Camarilla Pivot point, the zone becomes more reliable as potential support or resistance.
3. Which is better for intraday trading: Fibonacci or Camarilla?
For fast-moving intraday setups, Camarilla Pivots often provide sharper reversal points. Fibonacci, however, works well for identifying pullbacks within broader intraday trends. Choosing depends on whether the market is choppy or trending.
Camarilla Pivots and Fibonacci Retracements are not competitors; they are context-dependent tools.
Camarilla shines in sideways intraday markets, while Fibonacci thrives in trending moves.
Instead of asking which is more precise in absolute terms, a more useful question is: which market am I trading right now?
By aligning the tool with the condition, and by combining both when they converge, traders can achieve a higher level of precision than either indicator provides alone.
Disclaimer: This material is for general information purposes only and is not intended as (and should not be considered to be) financial, investment or other advice on which reliance should be placed. No opinion given in the material constitutes a recommendation by EBC or the author that any particular investment, security, transaction or investment strategy is suitable for any specific person.