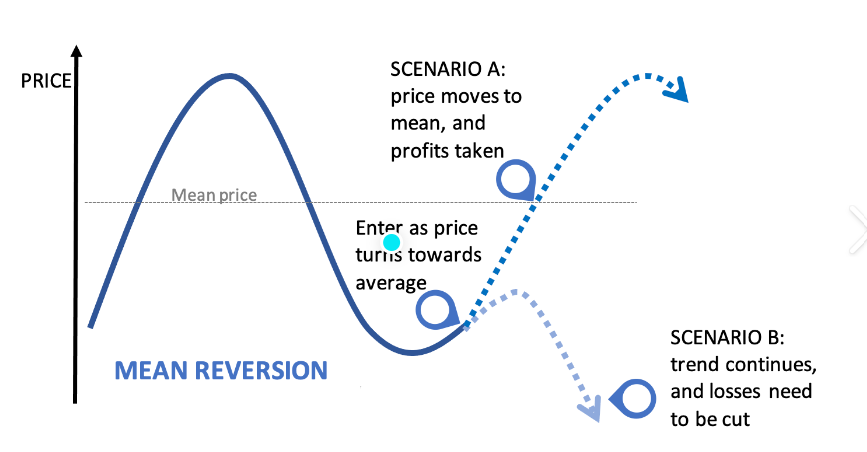
Mean reversion is one of the most widely used trading strategies in financial markets. The approach appeals to traders who believe asset prices tend to return to their historical averages after extreme movements.
For example, many traders and institutional investors employ mean reversion techniques in stocks, forex, and commodities to capitalise on price corrections.
However, while mean reversion trading can be profitable, it comes with inherent risks that traders must manage carefully.
Understanding The Theory Behind Mean Reversion in Trading

Mean reversion theory is based on the assumption that asset prices and other financial indicators tend to move back to a long-term average or equilibrium level after experiencing excessive volatility. This mean can be determined using moving averages, historical price data, or fundamental valuations. The strategy works under the premise that extreme price movements, either upward or downward, are temporary and that prices will eventually return to their normal range.
For example, one key assumption behind mean reversion is that financial markets experience cycles. During bullish phases, assets may trade significantly above their historical averages, creating overbought conditions. Conversely, assets may trade below their historical mean, creating oversold conditions in bearish phases. Traders employing a mean reversion strategy enter positions expecting these extreme price movements to reverse.
However, not all price movements exhibit mean-reverting behaviour. Some assets, especially those experiencing strong trends or fundamental shifts, may not return to their historical averages. Therefore, selecting the right assets and timeframes is crucial for successful mean reversion trading.
Technical indicators such as Bollinger Bands, Moving Averages, and the Relative Strength Index (RSI) can help traders identify potential reversion points.
Key Indicators Used in Mean Reversion Trading
Traders using a mean reversion strategy typically look for assets that have deviated significantly from their historical averages. They employ various technical indicators to identify overbought or oversold conditions, signalling a potential reversal. Some common indicators used in mean reversion trading include:
Moving Averages – Traders use simple moving averages (SMA) or exponential moving averages (EMA) to determine the mean level. When an asset price deviates significantly from its moving average, it may indicate a potential reversion.
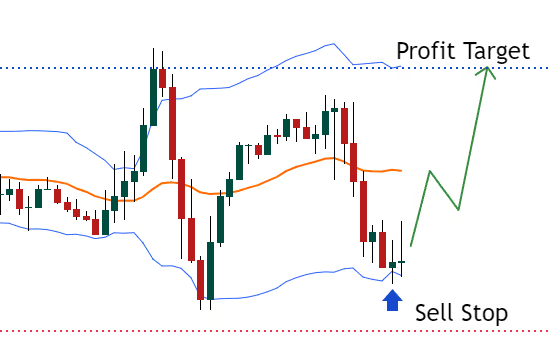
Bollinger Bands – These bands measure volatility and show whether an asset trades near its upper or lower extreme. A price that touches or moves beyond the bands often suggests that a reversion may be imminent.
Relative Strength Index (RSI) – RSI is a momentum indicator that helps identify overbought or oversold conditions. An RSI above 70 suggests an asset may be overbought and due for a correction, while an RSI below 30 indicates oversold conditions.
Mean Reversion Channels – These are custom-built price channels that help traders define the expected range of an asset's movement. When an asset moves beyond the channel, traders anticipate a reversion.
A typical mean reversion trade involves buying an asset when it falls below its historical mean and selling it when it moves above. Conversely, traders may short-sell assets trading significantly above their mean, expecting a downward correction.
How to Execute a Mean Reversion Trade

Successfully implementing a mean reversion strategy requires identifying assets that exhibit consistent reversion behaviour and using technical indicators to confirm trade signals.
1. Identifying Suitable Assets
Not all assets are suitable for mean reversion trading. Stocks with strong upward trends or those affected by significant fundamental changes may not revert to their historical averages. Mean reversion works best with assets that trade within a range and exhibit cyclical price movements.
2. Using Technical Indicators to Confirm Reversion Points
Traders use a combination of Bollinger Bands, RSI, and moving averages to identify trade entry points. When an asset's price moves beyond a standard deviation threshold or RSI reaches extreme levels, seek additional confirmation before executing a trade.
3. Setting Entry and Exit Points
A typical entry strategy involves buying when an asset is oversold and selling when it is overbought. Exit strategies depend on risk tolerance and expected price movement. Some traders exit at the mean, while others hold positions until reaching a profit target or trailing stop.
4. Managing Risk
Risk management is crucial in mean reversion trading, as assets may continue trending beyond expected reversion levels. Stop-loss orders prevent excessive losses if a trade moves against expectations. Position sizing is another key factor — traders allocate capital based on volatility and probability of mean reversion.
Real-World Applications Example
In the stock market, mean reversion is often used for pairs trading, where two historically correlated stocks deviate from their usual price relationship. Traders may buy the undervalued stock and short-sell the overvalued one, anticipating a return to their historical correlation.
In the forex market, currency pairs frequently revert to their mean due to macroeconomic factors such as interest rate differentials and geopolitical stability. Traders use mean reversion techniques to identify entry and exit points when currency pairs deviate from their expected value.
In commodities trading, prices often return due to supply and demand cycles. Commodities like crude oil, gold, and natural gas tend to fluctuate around their long-term production and consumption levels, making them suitable for mean reversion strategies.
Is Mean Reversion a Profitable Strategy?
The profitability of mean reversion trading depends on multiple factors, including market conditions, risk management, and execution strategy. In range-bound markets, mean reversion tends to work well, offering frequent trading opportunities with controlled risks. However, the strategy may underperform in trending markets as prices continue moving in one direction without reverting to the mean.
Many institutional traders and quantitative hedge funds successfully use mean reversion models by incorporating sophisticated algorithms and risk management techniques. However, individual traders must be cautious and adapt their strategies based on evolving market conditions.
For instance, traders who can identify reliable mean levels, use multiple indicators for confirmation and implement strict risk management will gain profit. However, it should not be used in isolation. Combining it with trend-following or momentum-based strategies can provide a more balanced trading approach, improving overall performance.
Conclusion
In conclusion, mean reversion is a well-established trading strategy that takes advantage of price deviations from historical averages. When applied correctly, it can be a profitable approach in range-bound markets. Traders use indicators such as Bollinger Bands, RSI, and moving averages to identify potential reversion points.
However, the strategy carries risks, particularly in trending markets where assets may not return to their mean. Yet, traders who combine technical analysis with risk management can use mean reversion to generate consistent profits while minimising losses.
Disclaimer: This material is for general information purposes only and is not intended as (and should not be considered to be) financial, investment or other advice on which reliance should be placed. No opinion given in the material constitutes a recommendation by EBC or the author that any particular investment, security, transaction or investment strategy is suitable for any specific person.


