Investing involves inherent risks, particularly due to the dynamic nature of the stock market. Investors seek ways to predict market movements to capitalize on wealth opportunities. Some rely on technical analysis tools, while others assess a company's operational capabilities for insights into future performance. Metrics like revenues and gross margins offer insights into current business conditions, but may not reliably forecast future trends. Inventory turnover, however, serves as a leading indicator in earnings reports, providing deeper operational insights. Let's delve into the analysis and application of the inventory turnover ratio.
What is Inventory Turnover Ratio?
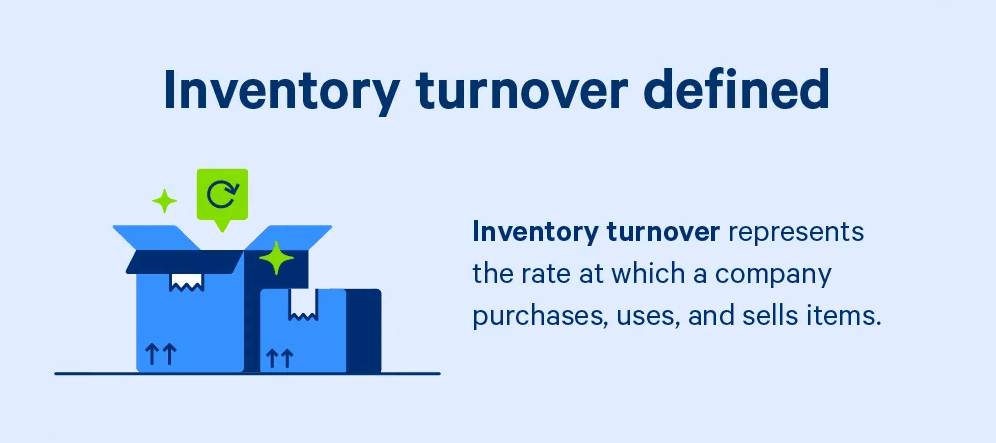
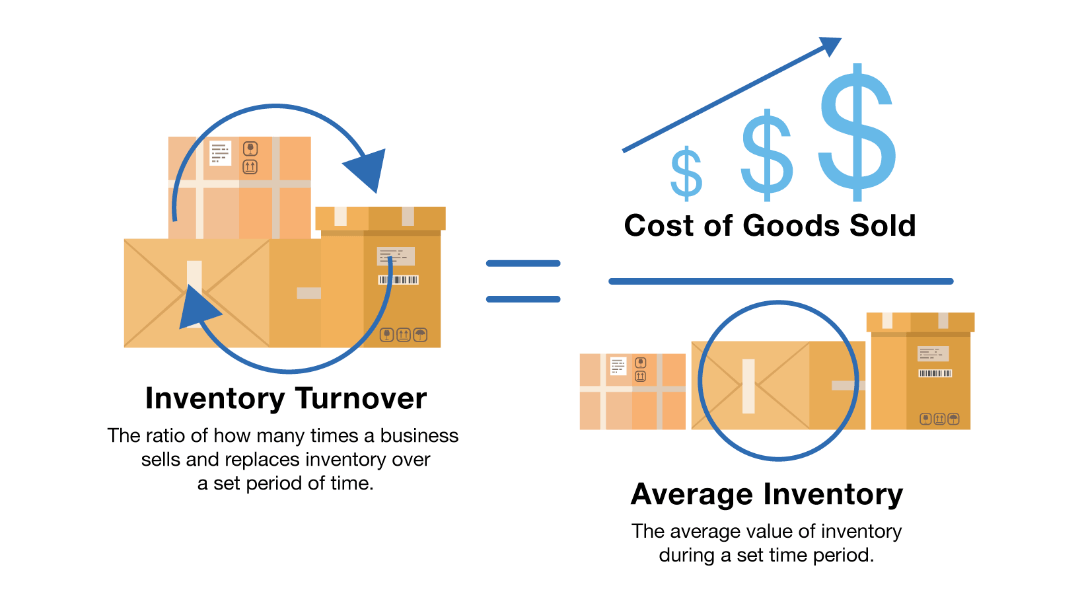
It is also known as the inventory turnover cycle, which is the ratio of the total value of inventory sold by a business to the average inventory value over a specific period of time. It represents the ability of an enterprise to convert inventory into sales revenue within a certain period of time, and is an important indicator of the efficiency of an enterprise's inventory management. Usually expressed in terms of times or days to measure the efficiency of enterprise inventory management and the frequency of business activities.
For example, if we go to a restaurant to eat, if the restaurant has more people in line and at the same time observes that it has a high turnover rate, then we will think that it is a good restaurant and will choose this restaurant to eat. Similarly, if you are a restaurant operator, to measure whether the restaurant is profitable or not, you will also look at the turnover rate, that is, to see how many customers can be served by the seats in the restaurant in a day.
That is if there are 20 tables and there are 40 customers today, then each table and chair can do business twice a day. Generally speaking, a restaurant is lucky to get 3-4 table turns a day. Restaurant tables and chairs are an asset to the company, allowing the seating capacity to serve more customers. So, increasing the table turnover rate is expected to generate more revenue for the restaurant.
Inventory turnover, which is the "table turnover rate" of a business, is the key to business revenue. The higher the turnover rate of a restaurant, the faster the turnover of seats, the more customers, and the higher the turnover. Similarly, the higher the inventory turnover cycle of an enterprise means the faster the turnover of inventory, the stronger the sales capacity, thus bringing more sales revenue for the enterprise.
It is not only a reflection of the efficiency of inventory management, but also a key indicator for assessing the operational capability of an enterprise. The level of inventory turnover ratio directly affects the profitability and liquidity of the enterprise. A high inventory turnover ratio means that an enterprise can quickly convert inventory into cash, which improves its operational efficiency and capital utilization efficiency.
At the same time, looking at the average number of times inventory is sold in a year can also show the company's operating ability. When the number of sales the faster the speed, it means that the sales capacity is also stronger. So we say that the inventory turnover ratio, a leading indicator, can be used to measure the speed of inventory turnover, the efficiency of production and sales, and the level of inventory to provide managers with the ability to monitor the development of the company's operations.
Suppose a company makes 3 batches of parts per month, but sells only one batch. This means that the amount of inventory in the warehouse will continue to increase as more parts are made than are sold. If the cost of goods sold is not rising, this may indicate that the inventory is not being sold completely.
It should also be noted, of course, that inventory turnover ratio standards vary from industry to industry, depending on the characteristics of the industry and the life cycle of the product. In perishable industries such as the food industry, inventory turnover cycles are usually required to be high to avoid expiration losses. Whereas, in consumer durables industry or raw material supply chain, the inventory turnover cycle is relatively low due to the long life cycle of the products.
To summarize, inventory turnover is one of the important indicators that investors should consider when evaluating the financial condition and future development trend of an enterprise. It is not only related to the profitability and liquidity of an enterprise, but also a reflection of its operational efficiency and competitiveness.

Inventory Turnover Ratio Calculation Formula
As an important indicator of a company's inventory liquidity and operational efficiency, its formula is also very simple, basically sales divided by average inventory. For example, a company is manufacturing and selling smart phones as its main business item. With the selling price and cost of each cell phone remaining the same, let's say the average inventory is 50.000 cell phones.
If a total of 200.000 cell phones can be sold in a full year, this means that the company can sell four times the average amount of inventory in a year, and the inventory turnover cycle is equal to four times. In other words, on average, an average inventory of 50.000 phones can be sold in roughly 90 days.
But this is a bit of a lazy calculation, because it should actually take into account that the selling price and cost of the product may change at any time. So the correct formula is: Inventory Turnover Ratio = Cost of Goods Sold / Average Inventory. That is, it should be returned to the amount of value to calculate, so that the resulting value will be more accurate.
The cost of goods sold refers to the cost of goods sold in a certain period of time, including direct material costs, direct labor costs and manufacturing costs. Average inventory, on the other hand, is the average value of inventory at the beginning and end of a given period, and because a company's inventory levels are constantly changing.
So a simpler algorithm would be to take the amount of inventory at the beginning of the period and add it to the amount of inventory at the end of the period and divide by two. Specific formula: (opening inventory + closing inventory) / 2. In other words, the inventory turnover formula: [cost of goods sold / (opening inventory + closing inventory)]/2
For example, the company's cost of goods sold this year is 10 million dollars, and the beginning of the inventory inventory amount is 2 million dollars, the end of the year is 3 million dollars, then the inventory turnover ratio is equal to 10 million divided by 2 million plus 3 million divided by 2 = 4 times.
As for the so-called inventory turnover days, it means that it takes about a few days to sell an average inventory. In the case of the company mentioned above, it is equal to 365 days divided by 4 times, and it takes about 90 days to sell an average inventory.
What is the Appropriate Inventory Turnover Ratio?
It is generally accepted that a higher inventory turnover ratio is better. A higher ratio usually indicates that a company is utilizing its inventory more efficiently and quickly converting inventory into sales revenue, thereby increasing the speed of capital turnover. This helps to reduce inventory backlogs, lower inventory costs, increase liquidity, and improve the profitability and competitiveness of the enterprise. Therefore, generally speaking, a higher inventory turnover ratio is a goal sought by enterprises.
Simply put, if the ratio is higher, it means that the inventory stays in the warehouse for a shorter period of time, which means that the inventory can be sold out more quickly. Therefore, it is often interpreted by investors as a company's ability to sell or operate.
Generally speaking, the higher the turnover rate, the more capable the business is, and the better the business is doing. On the contrary, if a company's inventory turnover cycle rate is lower than that of its peers, or has been decreasing in recent years. In addition to poor sales, some industries face the risk of inventory depreciation.
In the case of consumer electronics, such as smartphones, for example, if inventory builds up for too long, consumer novelty may wear off or competitors' technology may overtake it. In this case, the value of the inventory may drop significantly, leading to losses for the company, which in turn affects its share price. It can be seen that for the average business, a higher inventory turnover ratio indicates that they are doing better in terms of sales.
However, it is important to note that an increase in the inventory turnover cycle does not directly mean that the company is selling better. Since an increase in the inventory turnover ratio can be caused by an increase in demand across the industry, this means that it is easier to sell inventory for either business when demand is outstripping supply. Also too high inventory turnover ratios mean that inventory levels are too low, resulting in insufficient stock to meet customer demand.
So the right inventory turnover ratio should be the result of balancing inventory management and capital flow, and it also depends on the specifics of the business and industry standards. There is no one-size-fits-all figure for what is considered a good inventory turnover ratio. Rather, it should be based on different industries inventory, time product life cycle length and different. Inventory turnover ratios for different industries have different standards.
Taking the semiconductor industry in recent years as an example, an excellent inventory turnover ratio is about 2.3 times, which is equivalent to selling out inventory once in 159 days. Once a company's inventory turnover ratio is lower than 0.73 times, it means that the inventory turnover days are as long as 500 days, and the sales rate is seriously lagging behind the industry.
And in the automotive industry, an excellent inventory turnover ratio is about 4.53 times. If it is lower than 1.05 times, it is seriously lagging behind the same industry. Once a product has been in stock for too long, and the freshness of the consumer has worn off or the technology has been surpassed by rivals, the inventory is prone to be stacked and stagnant, resulting in losses for the company.
For example, in the food industry, raw materials can't be stored for long, especially perishable items like fresh produce, meat, and dairy, which need to be sold quickly. As a result, turnover days tend to be short. On average, food industry inventory turns over about 4 to 6 times a year, meaning it is sold in roughly 60 to 90 days. In contrast, the steel industry has longer product life cycles and manufacturing times, so inventory can take 6 months or more to turn over. In this case, the turnover ratio is about 0.8 times a year, meaning it takes around 450 days to sell through the inventory.
Comparing the two, the steel industry is less concerned about inventory turnover than other industries. For investors, they can assess the appropriateness of a company's inventory turnover ratio by comparing it to competitors in the same industry, or by referring to industry averages.

Tips for Using Inventory Turnover Ratio
Although the inventory turnover cycle can be used as an indicator to assess a company's operational capability, it needs to be compared with caution due to the differences in the nature of inventories in different industries. In other words, if an investor wishes to assess the operating ability of two companies through the inventory turnover ratio, he or she must ensure that the two companies belong to the same industry so that the comparison is meaningful.
For example, company a has an inventory turnover ratio of 1.5 times, while company b has 1.2 times. However, it can not be concluded that the operating conditions of company a must be better than company b, but also depends on a variety of industries of the two companies. If the two companies belong to the same industry, then of course there is a certain degree of reference significance. But if a, b two companies belong to different industries are very difficult to determine, for example, the food industry and the steel industry.
This is because in the food industry, its uniform average inventory turnover ratio may be two times. And in the steel industry, its inventory turnover ratio may be 0.8 times. Therefore, the inventory turnover cycle alone does not indicate which of the two companies, a and b, is in a better operating position.
In addition to competition, firms sometimes employ tricks to increase inventory levels, which can lead to a sharp decline in their inventory turnover ratios over a period of time. These skillful means may increase an enterprise's inventory level in the short term, but if inventory cannot be quickly converted into sales revenue, it will lead to a decline in the inventory turnover ratio, which will affect the enterprise's liquidity and operating efficiency.
For example, an enterprise took advantage of the low price of raw materials in the first half of the year, a large number of raw materials purchased and deposited in inventory, which led to a significant decline in the inventory turnover ratio in the first half of the year. And this practice because the enterprise can save a large amount of raw material costs, but can make him a big profit.
Investors view the inventory turnover ratio as a leading indicator of a company's operations because it is more timely than changes in revenue and directly reflects the speed of inventory turnover and the ability of the company to sell. At the same time, rapid changes in the inventory turnover ratio may signal a change in business conditions.
If the inventory turnover ratio drops suddenly, it may mean that the enterprise is facing sales difficulties, inventory backlogs or production problems, which may affect the profitability and financial position of the enterprise. On the contrary, if the inventory turnover ratio improves, it may indicate that the sales ability and operational efficiency of the enterprise has improved, which is conducive to improving the profitability and market competitiveness of the enterprise.
For example, one of the two companies, Company A, had an inventory turnover ratio of about 1.27 times in the third quarter of the year, and then gradually increased. By the fourth quarter of the next year, it had reached 2.3 times, nearly tripling the turnover rate. During this period, monthly revenue also climbed from 400 million yuan to 1.2 billion yuan, a three-fold increase.
From this, we can see that the overall revenue has continued to rise because the sales situation during this period has been getting better and better. Therefore, his share price naturally rose from the original $46.4 to $174.
On the other hand, Company B's inventory turnover ratio declined in the third quarter of that year in line with its revenue, from 3.11 times $44 billion to 1.42 times $12 billion at the end of that year. With the inventory turnover ratio plummeted by about 50%, the crisis of inventory decline also greatly increased, which indirectly also affects the performance of store revenue. As a result, the stock price fell from the original 700 dollars to 140.140 dollars or less.
If a company's inventory turnover ratio and revenue are increasing, then operations are probably in good shape. However, if you find that the inventory turnover ratio is declining while the revenue is increasing. It means that although the company's revenue is still growing, its sales may not be what they used to be.
Considered on its own, a change in the inventory turnover ratio is often a harbinger of a reversal in operating trends for many companies. It may suggest that the business is not doing well or is facing market challenges, which can affect profitability and share price performance. So it is important to critically assess the subsequent situation if this is detected.
Although companies do not update their earnings reports frequently and do not issue frequent press releases about their business conditions. However, even with limited information, it is not impossible for investors to adjust their investment strategies in advance if they are able to pick up on market developments more acutely than others. Therefore, taking into account changes in inventory turnover and comparisons with the level of the same industry when assessing the operating ability of a stock-holding company can lead to a more robust investment decision.
Normal range of inventory turnover
| Industries |
Average annual inventory turnover |
| Financial |
227.56 |
| Services |
26.22 |
| Energy |
10.09 |
| Utilities |
9.44 |
| Transportation |
9.40 |
| Retails |
9.40 |
| Technology |
6.99 |
| Consumer Non Cyclical |
5.94 |
| Consumer Discretionary |
4.97 |
| Basic Materials |
4.95 |
Disclaimer: This material is for general information purposes only and is not intended as (and should not be considered to be) financial, investment or other advice on which reliance should be placed. No opinion given in the material constitutes a recommendation by EBC or the author that any particular investment, security, transaction or investment strategy is suitable for any specific person.


