Fibonacci retracement is a popular tool among traders and analysts for identifying potential support and resistance levels in financial markets.
Rooted in the mathematical principles discovered by Leonardo Fibonacci, this technique simplifies the complex movements of asset prices as a series of numbers where each number is the sum of the two preceding ones, making it accessible even for beginners.
Understanding the Fibonacci Sequence and Fibonacci Retracement Levels

The Fibonacci sequence is a series of numbers where each number is the sum of the two preceding ones, starting from 0 and 1. It results in a sequence like 0, 1, 1, 2, 3, 5, 8, 13, and continue.
As the sequence progresses, the ratio between consecutive numbers approaches approximately 1.618, known as the "golden ratio" or "phi." This ratio is prevalent in various natural phenomena and has been observed in financial markets like Forex.
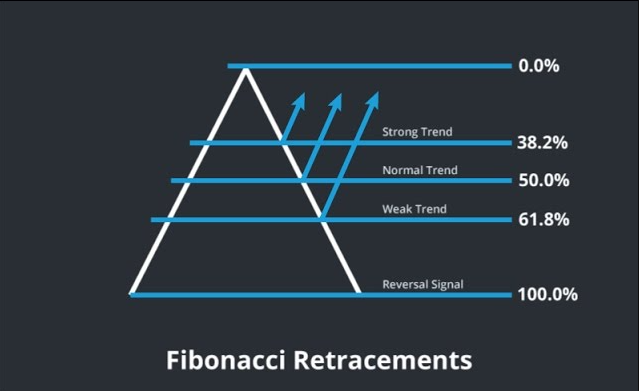
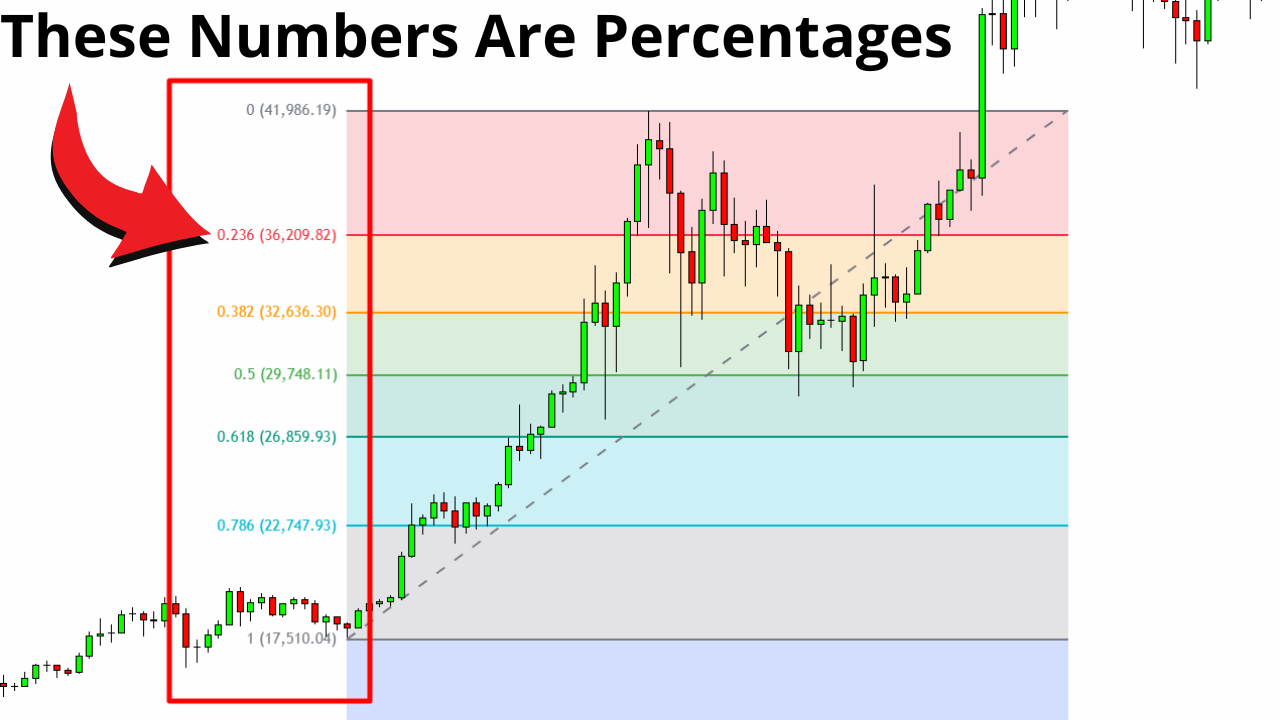
Fibonacci retracement levels are horizontal lines that indicate where support and resistance are likely to occur. They are derived from the key Fibonacci ratios: 23.6%, 38.2%, 50%, 61.8%, and 100%. These levels represent potential areas where the price of an asset might retrace before continuing in the original direction of the trend.
For instance, after a significant price increase in an uptrend, the asset might revert to one of these levels before resuming its upward movement.
How to Draw Fibonacci Retracement Levels

To apply Fibonacci retracement levels to a price chart, follow these steps:
Identify the Trend: Determine the asset's current trend direction —whether it's an uptrend or downtrend.
Select Significant High and Low Points: In an uptrend, choose the most recent significant low (swing low) and high (swing high). In a downtrend, select the most recent significant high and low points.
Apply the Fibonacci Tool: Use the Fibonacci retracement tool available on most trading platforms. For an uptrend, click on the swing low and drag the cursor to the swing high. For a downtrend, click on the swing high and drag to the swing low.
Analyse the Levels: The tool will generate the key Fibonacci levels on the chart, highlighting potential support and resistance areas.
It's important to note that while the 50% level is not a Fibonacci ratio, it is commonly included due to the market's tendency to retrace half of a prior move.
How to Use Fibonacci Retracement in Trading
Fibonacci retracement strategies help traders identify high-probability entry and exit points by capitalising on natural price pullbacks within a trend. One common approach is the trend continuation strategy. In an uptrend, traders wait for a pullback to a key Fibonacci level, such as 38.2% or 61.8%, and enter a long position when price action shows signs of reversing upward. The opposite applies in a downtrend, where traders may short the asset after a retracement to one of these levels shows resistance.
Another popular method is combining Fibonacci retracement with support and resistance levels. When a Fibonacci level aligns with a previous support or resistance line, it forms a confluence zone, increasing the likelihood of a price reaction at that point. Traders often seek confirmation through candlestick patterns or momentum indicators like RSI or MACD before taking action.
Breakout strategies can also be enhanced using Fibonacci levels. If the price consolidates near a retracement level and breaks through with strong volume, it could signal a continuation in the direction of the prior trend. Stop-loss orders are usually placed slightly beyond the next Fibonacci level to manage risk effectively.
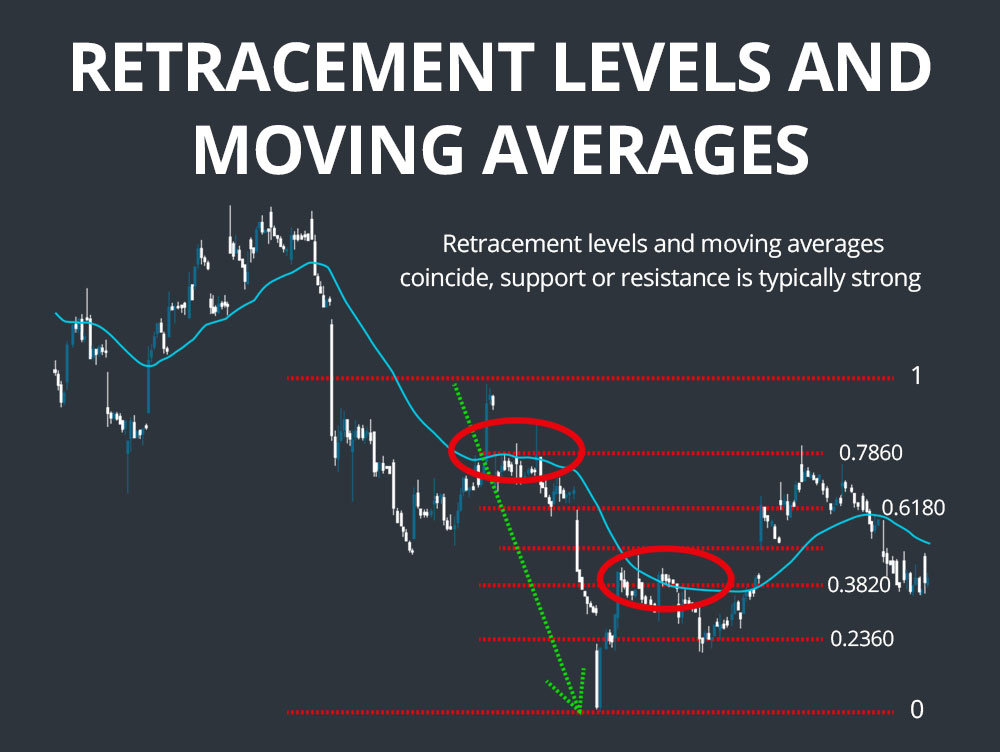
Finally, traders may use Fibonacci levels in combination with moving averages. For instance, if the 50-day moving average coincides with the 61.8% retracement level during a pullback, it can strengthen the case for a potential price reversal. These strategic applications make Fibonacci retracement a versatile and widely adopted tool for novice and experienced traders.
Limitations and Considerations

While Fibonacci retracement is a valuable tool, it is not infallible. One of the primary concerns is its subjective nature. Different traders may identify different swing highs and lows, leading to varied retracement levels that can generate conflicting signals. This inconsistency can reduce reliability, especially in choppy or low-volume markets where price movements are erratic.
Another key limitation is that Fibonacci levels are not predictive by themselves — they merely suggest potential areas of interest based on past price action. Without confirmation from other indicators or price behaviour, these levels may serve as weak decision points. Traders may enter or exit positions prematurely if they rely solely on Fibonacci retracement without additional context.
The risk of overfitting is also present. Because Fibonacci levels appear frequently on charts, it's easy to fall into the trap of seeing patterns where none exist. Just because a price reacts to a 38.2% or 61.8% retracement level does not guarantee future reactions at those same levels. Markets are influenced by numerous variables, such as economic data, geopolitical events, and investor sentiment, which may override technical levels.
Additionally, Fibonacci retracement is more effective in trending markets. In sideways conditions, the tool loses its practical utility, as prices may fail to show meaningful directional movement after hitting a retracement level. Traders must also be cautious of false breakouts and fake signals near Fibonacci levels, which can lead to losses if trades are not well-managed.
To navigate these limitations, traders must use Fibonacci retracement with other tools like volume indicators, oscillators, or trendlines. Setting clear risk management parameters, such as stop-loss orders and profit targets, can also mitigate potential downsides.
Conclusion
In conclusion, the Fibonacci retracement offers traders a systematic approach to identifying potential support and resistance levels, simplifying the analysis of price movements. By understanding the principles behind the Fibonacci sequence and applying retracement levels to price charts, beginners can enhance their trading strategies and make more informed decisions.
As with any technical tool, practising and combining Fibonacci retracement with other indicators is crucial to maximising its utility and accuracy.
Disclaimer: This material is for general information purposes only and is not intended as (and should not be considered to be) financial, investment or other advice on which reliance should be placed. No opinion given in the material constitutes a recommendation by EBC or the author that any particular investment, security, transaction or investment strategy is suitable for any specific person.


