Staying ahead of market trends and accurately predicting price movements is a critical skill in financial trading. One of the most widely used tools by professional traders to achieve this is the Volume Weighted Average Price (VWAP).
Although it has been around for decades, VWAP remains essential for traders who want to make informed decisions about buying and selling stocks, commodities, and other financial instruments.
Understanding the Basics of VWAP

The indicator is a trading benchmark that gives the average price throughout a given trading period, weighted by the volume of shares traded at each price level. To summarise, it combines price and volume data, making it more useful than a simple average price calculation.
VWAP is often used by institutional traders to gauge the market's overall trend, helping them determine whether they are buying or selling a stock at a favourable price. It is essential because it represents a fair and efficient price for buyers and sellers.
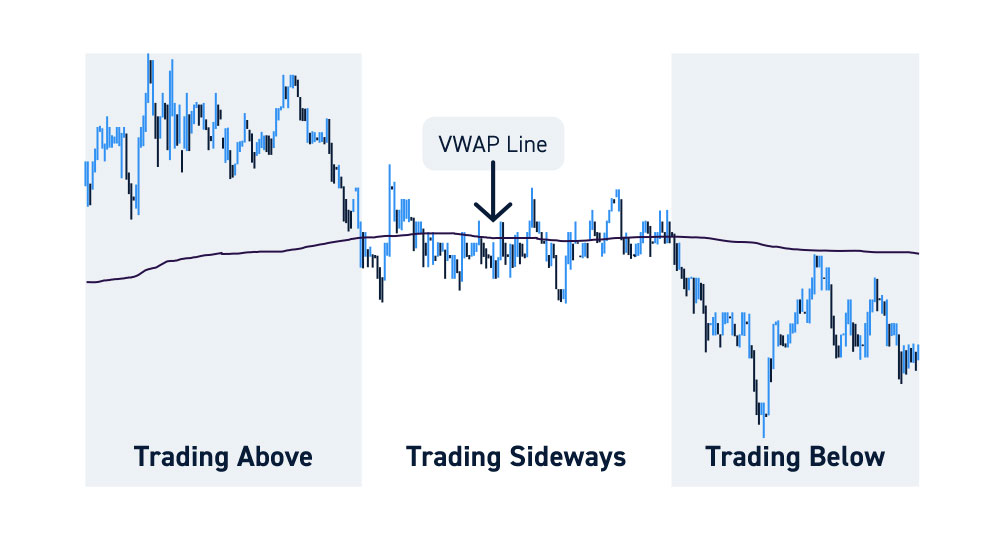
When the stock's market price is above the indicator, it typically indicates that buyers are in control, while a price below it suggests that sellers have the upper hand. It makes the indicator an essential tool for institutional traders and individual investors, providing a visible reference point for making decisions in a volatile market.
How to Calculate
VWAP is calculated by taking the sum of the value of all trades (price multiplied by volume) over a certain period and dividing it by the total volume for that period. The formula is as follows:
This formula gives the weighted average price for a security, accounting for the price at which the security is traded and the volume of shares traded at each price point. The calculation typically starts at the beginning of the trading day and is updated continuously throughout the day.
It is important to note that the indicator resets at the beginning of each new trading session. As a result, the calculation reflects only the trades made within that session and does not carry over from previous days.
Example of the Volume Weighted Average Price in Action
To understand how to calculate, let's walk through a simple example. Suppose we are analysing a stock's trading activity over 5 minutes. During this time, the stock has had several trades, each at different prices and volumes. Here are the details of the trades:
| Time |
Price |
Volume |
Price x Volume |
| 9.00 AM |
50 |
100 |
50 x 100 = 5000 |
| 9.01 AM |
51 |
150 |
51 x 150 = 7650 |
| 9.02 AM |
52 |
200 |
52 x 200 = 10400 |
| 9.03 AM |
53 |
50 |
53 x 50 = 2650 |
| 9.04 AM |
54 |
100 |
54 x 100 = 5400 |
Now, let's calculate the VWAP step by step:
1) Calculate the Total Price × Volume: We sum the value of all trades (Price × Volume).
2) Calculate the Total Volume: We sum the volume of all shares.
3) Calculate the VWAP: To calculate VWAP, we divide the total price × volume by the total volume.
Thus, the VWAP for this 5-minute period is $56.83. It represents the stock's average price during that time, weighted by the volume of each trade.
The Role of VWAP in Market Analysis
1) Identifying Trends
One of VWAP's key uses in market analysis is identifying the prevailing market trend. When the price of a security is trading above the indicator, it suggests that buyers are in control of the market, and the security is likely experiencing an uptrend. Conversely, when the price is below the indicator, it suggests that sellers dominate and the market is in a downtrend.
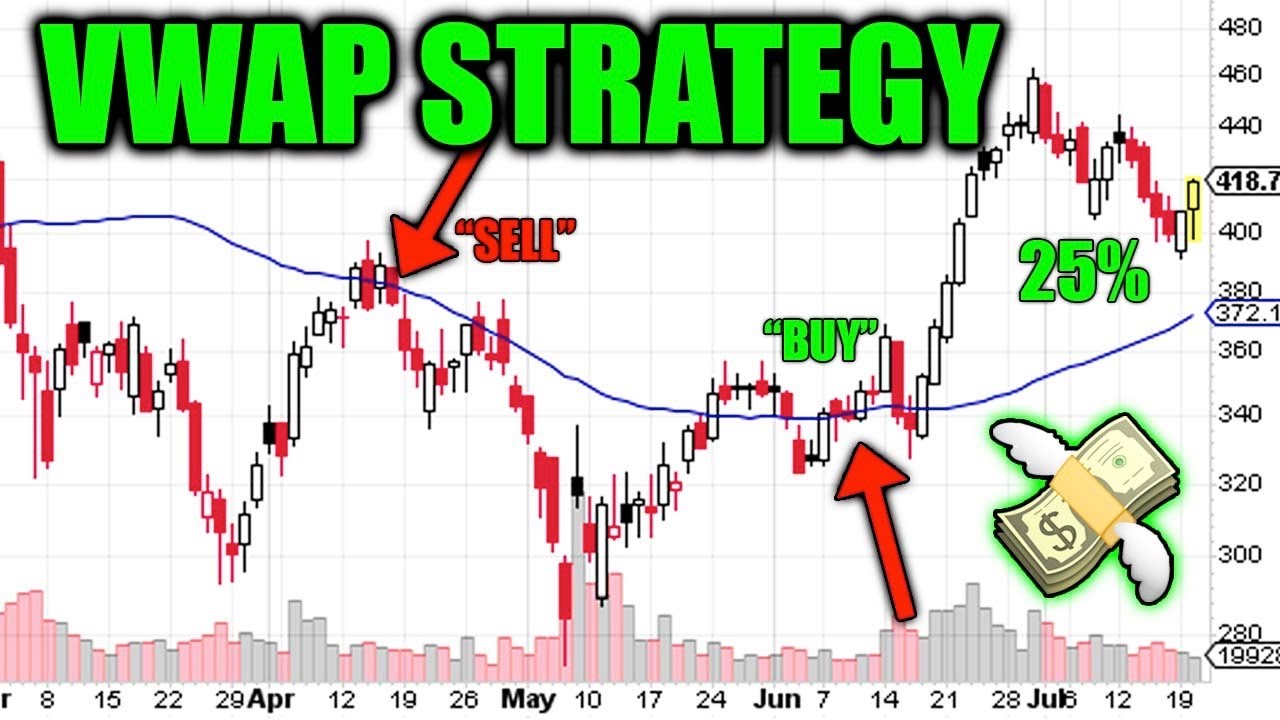
Traders use this information to decide when to enter or exit positions. For example, if the price of a stock crosses above the VWAP during the trading day, it could signal a buying opportunity, as the price is now moving in favour of the bulls. On the other hand, if the price crosses below the indicator, it may signal a selling opportunity, as the bears are starting to take control.
2) Confirmation of Market Sentiment
In addition, traders use the indicator to confirm market sentiment. If the price of an asset is above the VWAP and there is strong volume, it is often seen as confirmation that the bullish sentiment is real and sustainable. Conversely, if the price is below with high volume, it may indicate that the bearish sentiment is more likely to persist.
Traders can use this information to adjust their strategies accordingly. For example, traders looking to take a long position may wait for the price to move above the VWAP before entering, as the market is signalling upward movement.
3) Support and Resistance Levels
VWAP can also act as a dynamic support or resistance level during the trading day. When the price of a security is above, traders may view the VWAP level as support. If the price falls and bounces upward, it suggests that buyers are stepping in to support the price.
Conversely, if the price is below the indicator, the VWAP line can act as resistance. If the price rises to VWAP and fails to break above it, traders may view this as a sign that sellers are holding the price down, reinforcing the downtrend.
These dynamic support and resistance levels are particularly valuable because they are updated in real time, giving traders an immediate indication of where the price may struggle to move past.
How Traders Use VWAP for Market Analysis

1) Intraday Trading
Intraday traders, or day traders, rely heavily on VWAP to make quick decisions during the trading day. They often use it to determine the best times to enter and exit positions based on short-term price movements.
For example, if a stock is trading above the VWAP and shows strong upward momentum, a day trader might buy into the strength, anticipating that the price will continue to rise.
Vice versa, if a stock is below the indicator and shows signs of further downward movement, the trader may look to short the stock or exit a long position.
2) Trend Following Strategies
Traders who employ trend-following strategies often use VWAP to confirm the market's direction. If the price is above the indicator, it confirms that the trend is upward, and traders may look to take long positions.
If the price is below the VWAP, the trend is likely downward, and traders may look for opportunities to short or stay out of the market entirely.
This way, the indicator can serve as a filter to help traders avoid trades against the prevailing trend. By only entering trades when the price is above or below VWAP, traders can increase their chances of success by aligning their trades with the overall market direction.
3) Swing Trading
Swing traders, who hold positions for several days or weeks, can use it to identify potential entry and exit points based on the stock's overall trend.
For example, if a stock has been in a downtrend and starts to rise above the VWAP, this could indicate a reversal, and the trader may consider entering a long position.
Conversely, if a stock is trending up but starts to fall below the indicator, it could be a sign of a potential reversal to the downside, prompting the trader to exit their position.
4) Risk Management Tool
Lastly, traders also use the indicator as a risk management tool. By setting stop-loss orders around the VWAP level, traders can protect themselves from adverse market movements. For example, a trader who buys a stock above it might set a stop-loss just below the VWAP level, as this would signal a potential reversal in the market.
Similarly, traders shorting a stock below the indicator may set a stop-loss above it, as a move back above this level could indicate a change in market sentiment.
Conclusion
In conclusion, VWAP is essential for traders who want to gain insight into the market's price action and make informed trading decisions. By providing a volume-weighted average price, the indicator gives traders a more accurate picture of where the market is moving and where price levels may act as support or resistance.
Whether used for intraday trading or trend following, VWAP remains one of the most reliable indicators in a trader's toolkit.
Disclaimer: This material is for general information purposes only and is not intended as (and should not be considered to be) financial, investment or other advice on which reliance should be placed. No opinion given in the material constitutes a recommendation by EBC or the author that any particular investment, security, transaction or investment strategy is suitable for any specific person.


