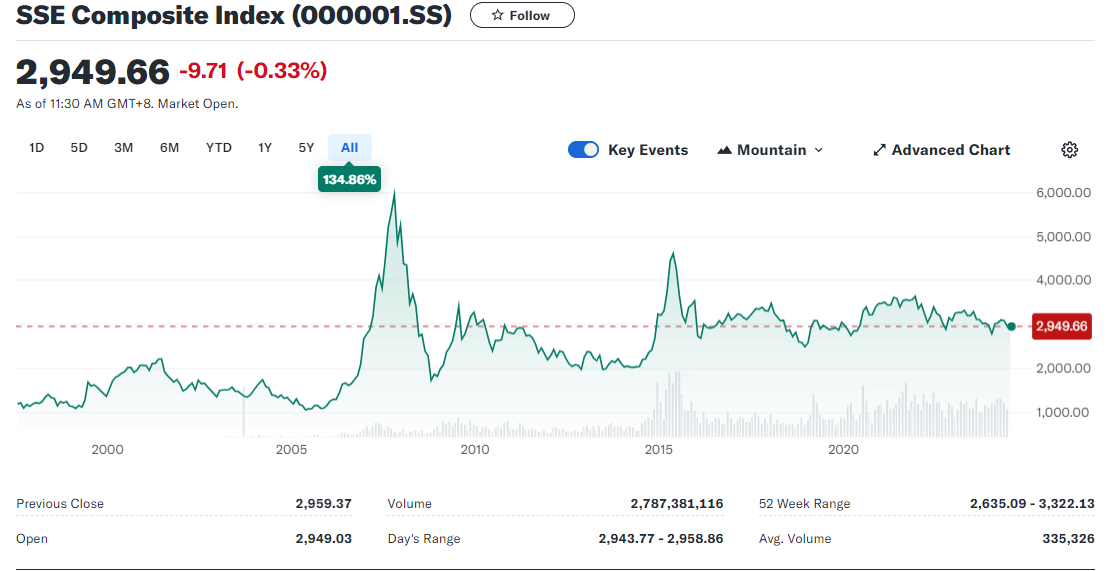
In the stock market, people generally choose to follow the general market to develop investment strategies. For example, the S&P, Dow, and Nasdaq of the U.S. stock market, as well as the Shanghai and Shenzhen indexes of China's A-share market, The recent sharp fluctuations of the Shanghai index, for which many investors are extremely concerned, are closely watching its trend. Therefore, this article will focus on the Shanghai index trend analysis and coping strategies.

What is Shanghai index?
It is the Shanghai Stock Exchange Composite Stock Price Index, or "Shanghai," from the abbreviation of Shanghai. It is also called the SSE Composite Index and is more commonly known by its other name, the SSE Index. As one of the main stock market indices of the Shanghai Stock Exchange in China, it reflects the movement of Stock Prices in the Shanghai stock market as a whole.
The SSE is one of the major stock market indices of the Chinese stock market, compiled and published by the Shanghai Stock Exchange (SSE). It was first published on July 15. 1991. with an initial base date of December 19. 1990. and a base point of 100 points. The SSE Index includes all stocks listed on the Shanghai Stock Exchange, with newly listed stocks included in the index calculation on the second trading day.
The SSE Index is compiled using the equity weighting method, which means that the weight of each stock in the index is weighted according to its market capitalization. This method means that stocks with a larger market capitalization have a greater weight in the index and a more significant impact on the index's volatility. This compilation method not only accurately reflects the performance of the large companies in the market but also the trend and volatility of the market as a whole.
In calculating the SSE Index, the Shanghai Stock Exchange takes into account a number of factors, such as the market capitalization and share prices of the companies participating in the index calculation, to ensure that the index truly reflects the overall market performance of companies of all sizes and sectors in the market. Movements in the indices not only have a direct impact on investors' investment decisions but also play an important role in market sentiment and financial market stability.
The compilation process of the Shanghai Index is supervised and participated in by a series of important financial market organizations, including the Shenzhen Stock Exchange and the CSI Index Company. These organizations ensure the fairness and validity of the index through the formulation and implementation of index compilation rules. As one of the major stock market indices of the Chinese stock market, the SSE Index is an important reference in financial market analysis, economic situation assessment, and investment strategy formulation.
The CSI is mainly composed of two parts: large-cap stocks and mid-cap stocks. The white line is usually used to represent large-cap stocks (stocks with larger weights), and the yellow line represents small- and mid-cap stocks (stocks with smaller weights). When the index rose, the yellow line in the white line was above the small and medium-sized stock performance. Conversely, the small and medium-sized stock performance was relatively weak.
With the continuous development of China's stock market, the SSE Index added an A-share index and a B-share index in 1992 to better reflect the market trends of different types of stocks, and in 1993. it added a number of categorized indices, such as industrial, commercial, real estate, and public utilities indices, to reflect the performance of stocks in different industries in a more detailed manner.
The SSE Index uses all A shares and some B shares listed on the Shanghai Stock Exchange as sample stocks, covering representative stocks of different industries. The index comprehensively reflects the overall price trend of stocks listed on the Shanghai Stock Exchange, encompassing the market capitalization and share price performance of various types of companies. In this way, the SSE Index is able to comprehensively reflect the overall trend of the Shanghai stock market, providing investors with important market reference information.
As an important weathervane for China's stock market, the SSE Index directly influences investor sentiment and market expectations. Investors often use the rise and fall of the SSE Index to judge the overall market trend as a reference for investment decisions. The fluctuation of the index also reflects the overall market enthusiasm and risk appetite and has an important impact on market liquidity and stability.
As an important indicator of China's stock market, the Shanghai Index not only reflects the overall performance of the stock market but also carries investors' expectations of the market's future trends. Through an in-depth understanding of the definition of the SSE Index, its compilation principles, and its role in the market, investors can more accurately grasp the pulse of the market and make more rational investment decisions.

Reasons for the Big Drop in the Shanghai Index
As an index reflecting the overall performance of the stock market, the current long-term downward trend of the Shanghai Index has triggered widespread investor pessimism. This downward situation is mainly caused by a combination of multiple factors, such as macroeconomics, policy regulation, international trade tensions, the market environment, company performance, investor sentiment, and technical indicators.
From a macroeconomic perspective, the economic slowdown and inflation are the two main factors affecting the stock market. Lower-than-expected economic growth may weaken corporate profitability, raising investor concerns about the stock market, which could lead to a decline in the stock market. High inflation may prompt the central bank to adopt monetary policy tightening measures, such as raising interest rates or reserve requirement ratios, to curb inflation, which may lead to a reduction in market liquidity, which in turn will have a negative impact on the stock market.
And the tightening of monetary policy, such as by the central bank raising interest rates or reducing market liquidity, has a negative impact on the stock market. Higher costs of funds and difficulties in corporate financing dampen economic activity and corporate earnings, which in turn affect stock market performance. There are also changes in fiscal policy, such as spending cuts or tax increases, which can dampen market confidence and affect corporate earnings expectations and investor sentiment, which in turn is not conducive to stock market stability.
Meanwhile, when the global economic situation is poor, such as due to an economic crisis or a slowdown in a major economy, it has a negative impact on China's stock market. Escalation of trade friction and intensification of geopolitical risks may similarly further weaken corporate profitability and lead to low investor confidence, increasing instability and volatility in the stock market, which in turn may cause the Shanghai Index to fall.
When there are excessive gains and high stock valuations in the stock market, it may also lead to investor concerns and pullback pressure, resulting in a market bubble. Meanwhile, when technical indicators show overbought or technical tops are formed, investors may choose to take profits, thus triggering a short-term decline. Alternatively, a massive sell-off by institutional investors or major shareholders may also trigger market panic, leading to follow-the-leader selling.
Corporate factors play a crucial role in the stock market, which mainly include both earnings declines and negative news. Declining earnings usually manifest themselves in the form of listed companies releasing financial reports showing earnings that fall short of market expectations, a situation that triggers investor concern about a company's future profitability, leading to a drop in share prices. On the other hand, negative news, such as the exposure of financial scandals or environmental issues, can also significantly affect market sentiment, lowering investor confidence in a company's prospects and, in turn, negatively affecting share prices.
Investor sentiment plays a key role in the stock market, especially in the expression of panic. When there is a general sense of panic and concern among investors, it often triggers a massive sell-off of stocks, leading to a decline in the stock market. This sentiment is usually triggered when there is significant negative news in the market or when the overall economic environment is unfavorable, and as a result, investors lose confidence in the market and choose to follow the selling wave. In addition, when market liquidity is tight, i.e., when the supply of funds fails to meet demand, it may also exacerbate the selling behavior, which in turn pushes the stock market further down.
In addition, technical factors have a significant influence on the stock market, especially since a break below a key support level usually signals a major change in the technical aspects of the stock market. Such a situation can inspire investors based on technical analysis strategies to sell, intensifying the downward pressure on the market. Key support levels are seen as signal points that stock prices may rebound or continue to fall, and once they are lost, they may trigger more counter-trend operations by investors, intensifying the market's downward trend.
On the other hand, highly leveraged funds play an important role in a declining market, especially when share prices fall below certain key levels, and may face mandatory liquidation of positions to control losses. This situation increases the selling pressure on the market as a large number of positions are forced to be closed, further accelerating the magnitude and speed of the market's decline.
The reasons for the sharp decline of the Shanghai Index in 2015 are manifold. First, a large amount of highly leveraged funds existed within the stock market, creating a market bubble. The implementation of the deleveraging policy at the time led to the large-scale liquidation of these funds, exacerbating the sharp decline in the stock market. Second, regulatory measures introduced by the government, such as restricting stock market financing and increasing stamp duty, further exacerbated market panic and triggered massive selling by investors.
The reasons for the decline in early 2020 were equally complex and varied. First, economic data showed the risk of a slowdown in economic growth, revealing market concerns about the economic outlook. Second, global inflationary pressures from rising international commodity prices and expectations of a possible tightening of monetary policy dampened investor risk appetite. Meanwhile, the intensification of trade friction between the United States and China and the escalation of other geopolitical tensions triggered risk aversion in the market, which had a negative impact on the stock market.
Currently, since the beginning of 2024. the Shanghai Index has been experiencing a sharp decline that lasted until June, mainly due to a general decline in the profits of small and medium-sized enterprises (SMEs). Despite relatively stable profits for large corporations, PMI data for small and medium-sized companies showed poor business conditions, which exacerbated market concerns.
Market analysis showed that stocks with market capitalization less than $5 billion generally declined, while those with larger market capitalization were relatively stable or gained, highlighting the prevalence of small-cap stocks in the market downturn. While increased regulation and corporate counterfeiting incidents have impacted the market, the more fundamental market pressure has come from the overall downward trend in corporate profits, which exceeds the ability of a single event to impact the market.
By analyzing the reasons for the sharp decline in the Shanghai Index, investors can better understand the market trend and formulate investment strategies and risk management measures accordingly. In addition, investors need to continuously analyze market conditions to ensure that their investment strategies are sound and current.

Analysis of Shanghai Index Trend and Strategy
For analyzing the trend of the Shanghai index, investors can consider both technical and fundamental perspectives. By utilizing a combination of technical and fundamental analysis, investors can more accurately assess the market trend and thus formulate reasonable investment strategies and effective risk management measures.
From a technical perspective, various technical indicators and Chart Patterns can be used to analyze the trend of the Shanghai Index. For example, by analyzing daily, weekly, or shorter-term K-line charts, you can observe the trend of price movements, support and resistance levels, and determine the buying and selling forces in the market and the continuity of the trend.
Technical indicators such as MACD (moving average convergence and divergence indicator) and RSI (relative strength indicator) can help confirm buy and sell signals and overbought and oversold conditions in the market. In addition, tools such as Bollinger bands and moving averages can be used to determine the range of price fluctuations and turning points in the trend.
From a fundamental perspective, you can focus on economic data, policy changes, company earnings reports, and other factors that have a strong impact on the market. In particular, macroeconomic data such as the economic growth rate, inflation rate, and interest rate policy, as well as company fundamentals such as industry profitability and price-earnings ratio levels, are important factors affecting the trend of the Shanghai index. An in-depth analysis of these data helps investors assess the overall health of the market and the relative strengths and weaknesses of various industries, so as to adjust investment strategies and risk management measures.
For developing strategies, it is important to first identify which stage the current market is in. Dividing the market into different stages of rising and falling markets helps to understand the market trend more clearly. The rising market can be divided into the layout stage, acceleration stage, high point stage, and retracement stage; the falling market includes the retracement stage, panic stage, rebound stage, and bottom stage. Each stage has specific market characteristics and participant behavior; investors can take corresponding strategies according to these characteristics.
For example, in the layout of the rising market stage, gradually build positions to take advantage of the accelerated stage of the upward trend, while in the high point stage, gradually reduce positions to avoid high chasing. And in the falling market, you should be in the retracement stage to timely stop-loss out of the market, maintain a wait-and-see attitude in the panic phase, gradually look for buying opportunities in the rebound phase, and patiently wait for the bottom of the signal. This strategy helps investors effectively reduce risk and improve investment returns.
After understanding the market trend, the current K-line behavior analysis is a key step in helping investors develop trading strategies. Long-led K-line behavior is usually characterized by a sustained rise, reflecting strong market buying, and is suitable for participating in trades when laying out space and coin drilling space, taking advantage of the momentum of rising prices. Short-led K-line behavior shows a sustained downward trend, reflecting strong market selling pressure. Retail investors in the retail space should be carefully observed to avoid blind participation.
In the case of the multi-short game, the market may be more volatile and have an oscillating trend. Investors need to pay attention to the changes in the ratio of long and short power in order to determine the future trend of the market. The multi-purpose exhaustion zone refers to the market's multi-purpose power consumption and may indicate that the market is about to reverse or adjust. This time, investors should pay close attention to market signals and technical indicators of change and adjust the corresponding positions and strategies.
When formulating strategies based on the fundamental data of the Shanghai index, the ratio of up and down stops, the blow-up rate, the financing and bond data, and the turnover volume are the key indicators of market heat and capital flow. The up/down ratio reflects the ratio of the number of stops in the market, and a high up/down ratio usually indicates a high level of trading activity. The blow-up ratio, on the other hand, measures the proportion of stocks that hit the up/down stops in a given trading day, reflecting the degree of market enthusiasm for individual stocks.
Financing data provides information on investors' use of leveraged funds for trading, with high financing balances reflecting optimistic market sentiment and high financing balances suggesting investor concern about the risk of market downturns. Volume is an important indicator of market activity, and higher volume is usually associated with greater market volatility or higher levels of capital activity. These data help investors understand market trading activities and participant sentiment and provide an important reference for formulating investment strategies.
Overall, the analysis of the Shanghai index trend requires a combination of technical and fundamental factors, combined with real-time market dynamics and investor sentiment, before developing a flexible trading strategy. This includes the timely grasp of buy and sell points as well as the effective execution of risk control and money management.
Shanghai index trend analysis and response strategy
|
Trend Analysis
|
Coping strategies
|
| Focus on investor sentiment, including panic or optimism. |
Stay stable; avoid blind panic or following trends. |
| Analyze moving averages and RSI for technical insights. |
Use indicators for trend confirmation and trades. |
| Consider economic data and policy changes' market impact. |
Monitor policy for long-term market trend predictions. |
| Analyze the impact of current hot sectors or stocks. |
Focus on hot sectors or stocks for investments. |
| Manage portfolio risk; avoid excessive concentration. |
Manage risk with market-adjusted positions. |
Disclaimer: This material is for general information purposes only and is not intended as (and should not be considered to be) financial, investment, or other advice on which reliance should be placed. No opinion given in the material constitutes a recommendation by EBC or the author that any particular investment, security, transaction, or investment strategy is suitable for any specific person.


