In the field of investment, Joe DiNapoII, the father of Fibonacci technology, can be said to be a thunderbolt.
In his over 40 years of investment career, this investment master has achieved remarkable success in the trading market with thorough research on moving averages and his unique "swing indicator predictor". In the era of technological analysis being the king, a group of trading masters such as Tenapoli shone like stars, crisscrossing the trading market and relying on their own strength to snipe at institutional prices, making traders fearful.
However, trading technology is also a process of continuous iterative development. Even though awarded the godfather of Fibonacci technology by the market, Tenapoli admits to encountering bottlenecks.
How did he break free from shackles and continue to write a trading legend?
The Dark Hour of the Trading Master
2007-2008 was the most glorious two years for Joel Di Napoli's trading record. With years of impressive performance and easy to understand usage rules, his Tinapoli point trading method is regarded as a standard in the investment community.
But only in 2019, his achievements began to plummet.
Later, he recalled, "No matter what I did, it seemed like I was completely off target. Although I managed to avoid losses, it seemed more difficult than ever to make a profit. The disparity between reality and ideals made this master start to ponder the reasons behind it.
After two years of searching, Tinapoli found that the organization had already shifted from simple technical analysis to order flow analysis.
Tennapoli referred to the "order flow tool" as the "heavenly eye". Because he found that high-frequency traders and algorithmic machines had already mastered every move in the market through order flow tools; Facing technical analysis in front of it is like feeling a stone crossing a river, and the next step is whether it is deep or shallow, only by trying can we know.
During the difficult days, he even said, 'I am no longer the shrewd trader I used to be, but a pawn in this trading game.'.
The king returns and incorporates the order flow into the trading system
In those years of contemplating how to deal with order flow tools, Tenapoli recalled a previous sentence from his mentor: Market manipulators can lie and deceive, but they cannot hide their footprints in the market!
This sentence was a wake-up call, which made Tinapoli realize that the essence of order flow is precisely to analyze the direction of orders and find market footprints. Instead of isolated confrontation and survival, it is better to incorporate this powerful tool into its own trading system.
So, Tenapoli introduced order flow tools into its trading system and accepted clues to the market from market traces. He has also shifted from focusing on market information to focusing on changes in order prices, and has even reaped profits from abnormal market fluctuations multiple times.
In his own words, I have finally regained my initiative in the trading world.
EBC Group: Free use of order flow tools
Although order flow is useful, it is often expensive because it requires access to exchange data terminals, real-time quantitative analysis, and synchronous generation of price distribution maps, trading volume distributions, footprint charts, etc.
At present, the main users of order flow are institutional investors and large fund users. For example, more than 70% of Wall Street institutions rely on order flow tools to achieve high-frequency and programmed trading. But this also invisibly expands the information gap between institutions and general customers.
However, there are still very few high-quality platforms on the market that provide free order flow tools, such as the EBC platform, which has had a very good industry reputation in the past two years.
The official quotation for this set of tools was originally 19800 per year.
However, recently, the official website of the EBC Group announced that traders only need to add up their account balances under the EBC name to be equal to or greater than $10000 to receive the order flow tool for free, without any additional fees.
1. Top level exchange data
Whether the order flow tool is good or not, the first thing to look at is the connected exchange data - as the source of order flow data, the qualification of the exchange determines the quality of the data and directly affects the effectiveness of our order making.
The EBC Group's order flow tool partners include CME and the London Metal Exchange. Describe the weight of these two exchanges:

CME, also known as the Chicago Mercantile Exchange, is the world's most diversified derivative market leader. A significant portion of the orders for WTI Crude Oil, soybeans, gold, and many mainstream currency pairs that we trade on a daily basis come from ChiNext.
The London Metal Exchange, on the other hand, is the world's largest non-ferrous metal exchange, where many global trading orders for copper, aluminum, lead, zinc, nickel, and other commodities are conducted. Especially copper, 70% of the world's total copper production is traded based on its official market price.
As their partner, the EBC Group order flow tool has at least sufficient reliability on the data side.
2. Data depth
Data depth, in simple terms, refers to whether it can reflect the slightest changes in order data, and even reflect the timing and distribution trends of the main funds. For investors who enjoy high-frequency short-term trading, this is crucial.
With the data support of CME, EBC achieves real-time tick data for ten gear drive ports by directly connecting to CME, and timely captures drive port dynamics.
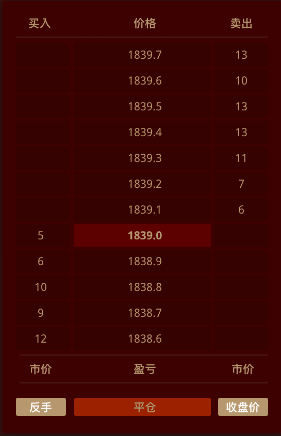
The EBC Group order flow tool synchronously incorporates the "trading behavior of large institutional market participants", and achieves "follow market trading" and improves the "trading success rate" by analyzing the behavior of the main funds in the market (such as fundraising and distribution).
3. Lowering user access barriers
EBCThe Group order flow tool has made many structural innovations based on its functional implementation. For example, with the integration of CME data and the advancement of data depth, EBC further developed the micro market institution analysis method.
Simply put, in the past, order flow tools only stayed at the data level, and how to use and analyze them ultimately relied on the traders themselves. EBC, on the other hand, integrates massive order data into a complete set of leading indicators, helping traders more intuitively identify fluctuations and trends, further lowering the user's usage threshold.
Tinapoli once said: In today's market environment, ignoring order flow is irrational behavior and may even lead to the ruin of your entire trading career.
As order flow tools become more and more well-known, more investors are beginning to understand and value order flow analysis. In particular, after the recent Silicon Valley Bank incident, the market has become complicated, and some professional investors have begun to look for key clues of market sentiment from the order flow.
Order flow tools, as another major innovation in the field of trading after technical analysis, will gradually become popular and penetrate into our trading. So, if you are interested in order flow tools, you can try them for free on platforms such as EBC.
In front of trends, only by making big strides can we avoid being thrown down by the rolling wheels.
What is information difference? In asset management, there is no need for order flow, it is information difference


