Published on: 2023-09-08
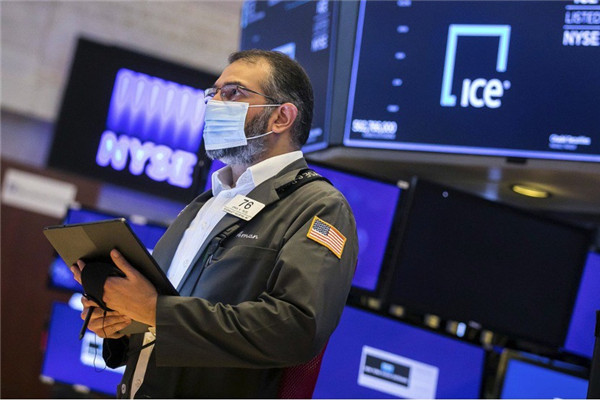
According to the Associated Press, US President Biden recently announced an agreement between the Democratic and Republican parties on infrastructure plans. The US stock market closed higher on June 24th, with the Dow Jones Index closing over 300 points higher and both the Nasdaq and S&P 500 indices reaching new market highs.
The Nasdaq rose as high as 14414 points and closed at 14369 points, up 97 points or 0.69%.


The S&P 500 index also reached a new high in the market, reaching a high of 4271 points before closing at 4266 points, up 24 points or 0.58%.
Since 2021, the S&P 500 index has risen by nearly 15%, surpassing the Nasdaq.
EBC has selected a series of top indices for you, including the Nasdaq NAS100, Dow US30, S&P 500, Nikkei JPN225, Hong Kong Hang Seng HK50, etc., to keep up with global economic trends and actively explore the most valuable and active sectors in the world.
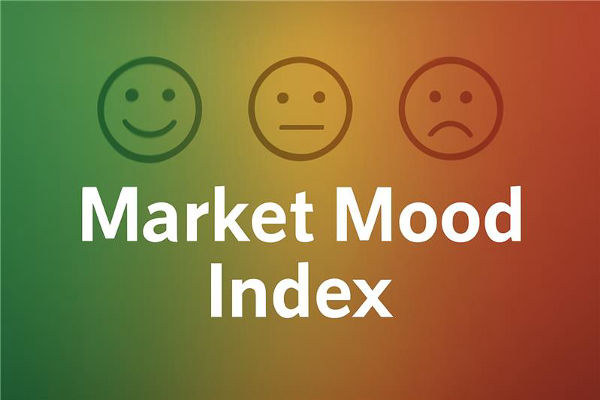
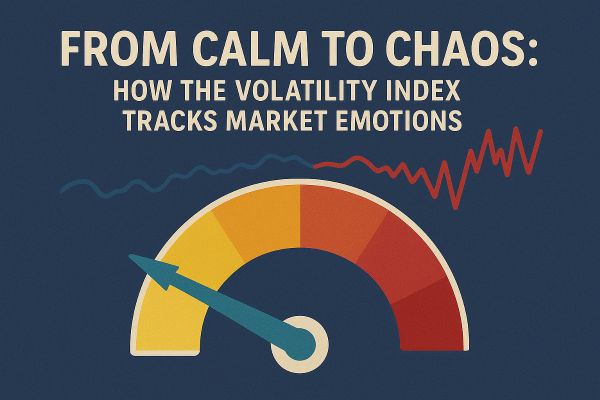
In this article, EBC takes you to explore the "prophet" behind the S&P500 index—the VIX panic index. Why does the name VIX come to the forefront whenever the market is turbulent? Why is VIX called a barometer of market sentiment? What is the subtle relationship between the VIX index and the S&P 500 index?
On October 19, 1987, the Dow Jones Index, which had fallen for three consecutive days, suddenly plummeted by 22.6% on that day. This stock disaster, which began in the United States and spread to Europe and Asia, made global investors realize that the Securities market urgently needed an index that could predict short-term risks to ensure the safety of investors' funds. So the VIX panic index emerged.
The full name of VIX is Chicago Board Options Exchange Volatility Index, also known as CBOE Volatility Index, which is translated as the Chicago Board Options Exchange Volatility Index in Chinese. Created by the Chicago Board of Options Exchange (CBOE) in 1990, it measures the expected volatility of S&P 500 index options over a 30-day period.
Due to the VIX index being commonly used to estimate risk, it is called the VIX panic index overseas.
The VIX index not only represents the expected views of most investors on the future market trend but also reveals the market's changes in future trends. When the VIX index value increases, it indicates that the future volatility of the market will increase, and there may be uncertain factors in the US stock market. When the VIX index value decreases, it indicates stable future volatility, and the US stock market will not experience significant fluctuations.
It is a countertrend indicator, meaning it can help investors find top, bottom, and equilibrium positions in a larger market. With the continuous maturity of the financial market and the increasing proportion of institutional investors occupying the market, VIX has become a comprehensive index to measure market sentiment rather than a technical indicator, which can help you determine when to enter or exit the market.
The VIX index uses the S&P500 as the benchmark to predict the market situation of the US stock market within 30 days, but it only predicts the completely opposite trend for the US stock market. Therefore, many investors view the VIX panic index as a safe haven index, while some institutions combine the VIX index with gold trends and USD/JPY to pay attention.
In terms of foreign exchange, the Japanese yen has always been favored by investors around the world as an international safe haven currency. When there are significant fluctuations in the stock and foreign exchange markets, investing in gold and yen as safe havens is also a good choice.

There is a strong negative correlation between the VIX index and US stock returns. If the VIX index rises, the S&P 500 index is likely to decline due to increased investor panic. If the VIX index falls, it indicates that investors are relatively under no pressure, and the S&P 500 index may be in a stable state.
The trading volatility index is not equivalent to a deterioration in market conditions, as it cannot be ruled out that the volatility index remains at a low level during a market downturn. In the past few years, if the VIX index is below 20, the market is considered to be in a stable stage, while a level of 30 or higher indicates significant market volatility.
Since 1990, the daily correlation coefficient between the S&P 500 index and the VIX index has been -77%. In the past 10 years, the negative correlation between the two has become stronger, at -81%. Before October 2008, its negative correlation was -74%.
It is worth noting that, in a statistical sense, the VIX index should be considered as the potential reaction of investors to the current market atmosphere, events, and news in the next month. A high VIX index cannot be equated with pessimism towards market performance but can only represent investors' belief that the market will experience severe fluctuations, which statistically includes both positive upward and negative downward risks.
VIX includes a fear premium (implied volatility often exceeds actual volatility), which provides a warning to prevent market crashes.
Like all indices, VIX allows you to gain a deeper understanding of the market. VIX is only an indicator of market sentiment, but even so, it is not enough to determine the details of what will happen next. When making decisions, one should not overly rely on them.
If you are investing in index-spread contracts, closely monitoring VIX will help maximize your investment return. Trading the most popular global indices in China, the United States, Europe, Asia, and Australia through the EBC trading platform
EBC relies on the group's headquarters in London to connect with deep liquidity pools of large institutions such as global first-tier investment banks and hedge funds. For you to achieve excellent trading conditions such as institutional-level tight price spreads, clearing-level market depth, and rapid transactions within milliseconds.
Disclaimer: This material is for general information purposes only and is not intended as (and should not be considered to be) financial, investment or other advice on which reliance should be placed. No opinion given in the material constitutes a recommendation by EBC or the author that any particular investment, security, transaction or investment strategy is suitable for any specific person.


World's Best Broker