Since Powell indicated stronger economic data could push the Fed towards
another rate hike last month, positive data have continued to stir up headwind
for stocks.
Soaring Treasury yields deter investors and renew fears of a downturn.
Typical correlations between asset classes all break down.
Almost everything is suffering selloff except the US dollar – a repeat of
what was happening in the second half of last year – although central banks are
nearing the end of tightening cycle.
The S&P 500 broke its bullish year-long uptrend this week. Market
watchers say it needs to hold above its 200 MA to stem further loss.
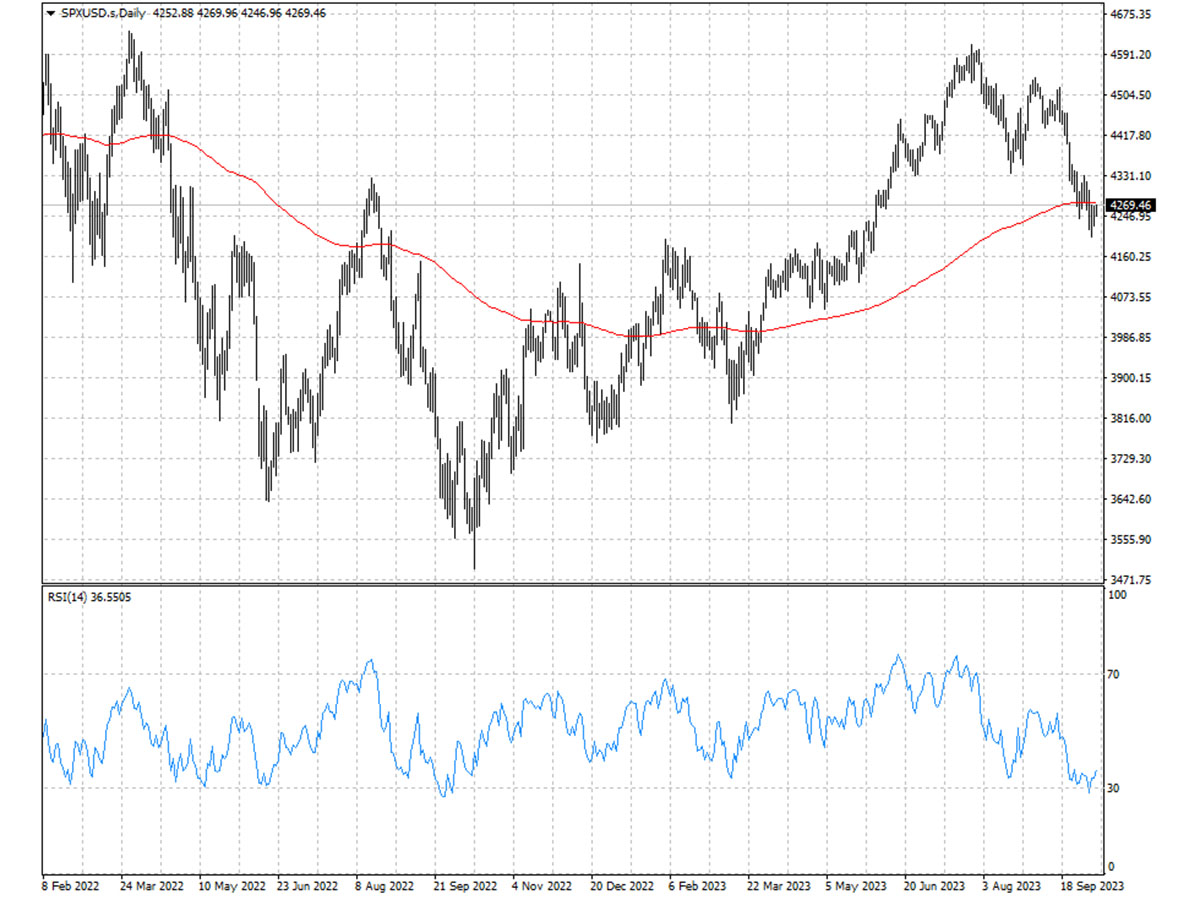
Even as the benchmark is still up more than 10% year-to-date, more than a
half of its members are down. The narrow breadth itself is typically a warning
sign that rally has no solid footing.
About 35% of the index constituents traded above their 200-DMAs. That figure
would need to drop below 20% for traders to believe stocks have capitulated,
according to Ari Wald, senior analyst at Oppenheimer.
VIX curves invert
While stock loss deepens, derivative markets priced in more turbulence in the
here and now than in the future.
The VIX hit 19.8 on Tuesday, pushing its spot price above three-month month
futures for the first time since banking crisis earlier this year.
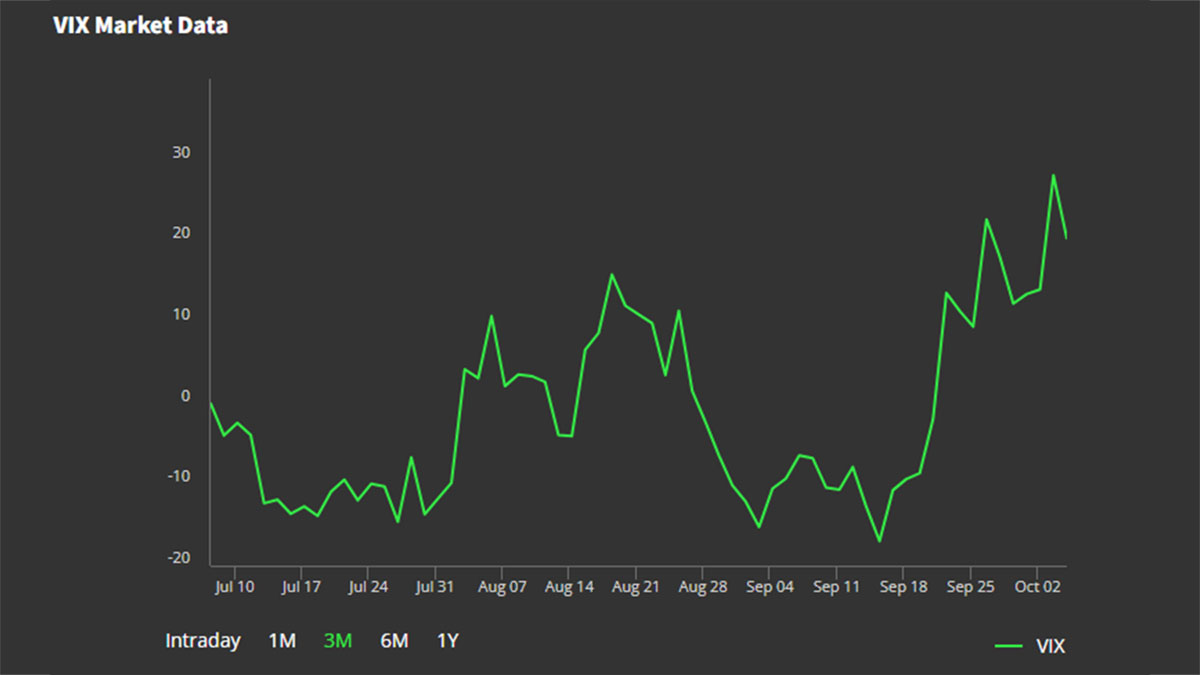
Notably that curve inversion occurred twice in the past year and both proved
to be a prelude to market bottoms so the pattern could be seen as a contrarian
indicator that a market recovery is in the build-up.
Nevertheless, the short-lived time spread paled in comparison to the level
seen during March and last October. For now, the term structure has been back to
normal.
CTAs are dumping equities, which warrants worsening investor sentiment. The
S&P 500’s 14-day RSI slid below the key 30 level on Tuesday for the first
time since September 2022.
Bulls may bear the brunt of further downturn before stocks finally stabilise.
JPMorgan’s Marko Kolanovic is bracing for a 20% sell-off to hit the S&P
500.
He warned that a recession is highly likely with high interest rates though a
near-term bounce cannot be ruled out depending on economic reports over the
following months.
Earning improvement
Net income at S&P 500 companies is projected to grow about 7.6% year on
year in the fourth quarter, snapping a run of four straight contractions,
according to Bloomberg.
The upbeat profit forecast suggests companies that grappled with margin
squeeze as inflation flared the past two years are now enjoying the benefits of
a slowdown in price growth.
Employers are also cutting costs to offset the impact from higher-for-longer
interest at the same time that the American consumer continues to spend at
relatively stable rates.
The profit recovery may not filter through to the Russell 2000 though as
smaller firms are more sensitive to rising interest rates. The index lags far
behind the S&P 500 so far this year.
Nonfarm payrolls increased by 336,000 jobs last month, double the 170,000
forecast by economists in a Reuters poll, though wage growth is slowing.
Companies in the S&P 500 likely earned $111 in net profit for every
$1,000 in revenue during the spring, the weakest level since the end of 2020,
according to FactSet.
BlackRock pointed to high labour costs eating into profit margins in the
second half. That could be less of a concern if the wage-price spiral grinds to
a halt.
Tech will outperform
Growth stocks are the place to be for the long term because they are more
resilient in the face of recession, according to Citigroup Inc. quantitative
strategists.
‘It carries less overall macro risk and may provide more downside protection
in a recessionary environment, while fully realizing the short-term risk of
further rising interest rates.’
UBS Global Wealth Management also like tech stocks, even after the recent
market rotation out of the sector. The bank said AI potentials will cause the
sector upside.
The Nasdaq 100 is still up roughly 35% this year after several painful
months. Its forward PE ratio is nearly 23 times, above the average of 20 times
for the past decade.
Disclaimer: This material is for general information purposes only and is not intended as (and should not be considered to be) financial, investment or other advice on which reliance should be placed. No opinion given in the material constitutes a recommendation by EBC or the author that any particular investment, security, transaction or investment strategy is suitable for any specific person.


