technical analysis methods are mainly used to determine the future direction
of the market through statistical and mathematical calculations and chart
drawing based on historical price and quantity data. Generally speaking,
technical analysis methods can be divided into five categories: K-line, tangent,
indicator, wave, and morphology. Below, HMA Huangma Forex Editor will
specifically analyze these types of technical analysis methods.

K-line class
By studying the graph formed by the movement of the K-line over a certain
period or multiple periods of time, we can infer the power comparison between
multiple parties and short parties in the current market and finally come up
with corresponding trading methods. From the morphology of price trajectories,
it can be inferred what kind of environment the market is in, which provides
certain guidance for future investments. It can be inferred that the strengths
of both the long and short sides of the market are compared, and then it can be
determined whether the advantage of both the long and short sides is temporary
or decisive. Common forms: head and shoulder top, red three soldiers, arc
bottom, etc.
Tangent class
According to the corresponding methods and means, draw some straight lines on
the data graph of the exchange rate, and then infer the short-term fluctuation
of the exchange rate based on these straight lines. The study of entry lines is
generally used to determine support and resistance lines. The function of the
tangent is mainly to support and exert pressure. The backward extension position
of the support line and pressure line has a certain constraining effect on the
price trend. The drawing method of tangents is the most important, as their
quality directly affects the predicted results. At present, there are many ways
to draw tangent lines, which are the essence of people's long-term research.
Famous ones include trend lines, channel lines, etc. In addition, there are
golden section lines, Gan's lines, angle lines, etc. In practical applications,
people benefit a lot from these online platforms.
Indicator class
Indicators should consider various aspects of market behavior, establish a
mathematical model, provide mathematical calculation formulas, and obtain a
number that reflects the inherent essence of a certain aspect of the forex market. This number is called the indicator value. The specific values
and interrelationships of indicator values directly reflect the state of the
forex market and provide guidance for operational behavior. The
indicators mostly reflect things that cannot be directly seen from market
reports.
At present, there are countless technical indicators of various names used in
the forex market worldwide—at least over a thousand. For example,
relative strength index (RSI), random index (Stochastic oscillator), trend index
(DMI), smooth similarities and differences average (MACD), energy surge (OBV),
psychological line, Bias ratio, etc. These are well-known technical indicators
that have been thriving and enduring in the stock market. Moreover, over time,
new technical indicators are constantly emerging.
Wave type
Eliot, the inventor and founder, judged forex trading through the
waves formed during the operation of exchange rates. This kind of fluctuation
also needs to be carried out according to the natural trend of fluctuations.
Simply put, an increase is five waves, and a decrease is three waves.
The most important motto about technical analysis is 'Trends are your
friends'. Because once the trend is established, it will definitely move forward
according to the rules and will not easily change. Finding the dominant trend
will help investors take a holistic view of the market and provide us with
sharper insights, especially when short-term market fluctuations disrupt the
overall market.
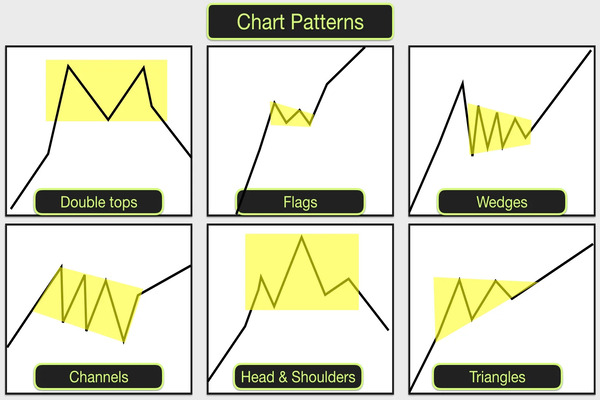
Morphological category
Morphology is a method of predicting the future trend of forex
prices based on the trajectory of past time in price charts. The pattern of
price movement is an important part of market behavior, and it is the specific
manifestation of the forex market's perception of various
information. It is reasonable to speculate on the future of forex
prices using price trajectories or patterns. From the shape of the price
trajectory, it can be inferred what kind of environment the forex
market is in. There are more than ten famous forms, including M head, W bottom,
head, shoulder, top, bottom, etc. These forms are also the crystallization of
people's wisdom.