Published on: 2025-04-23 Updated on: 2025-10-03

Imagine a crowded concert hall. At first, everyone rushes in, excited, cheering, and pushing closer to the stage. The energy feels unstoppable. But if you carefully monitor, you'll notice something: while the crowd is still loud and hyped, some people near the back doors begin quietly slipping out. Soon, more follow, and before you know it, the once-packed hall starts thinning out.
This is precisely what happens in the financial markets during Wyckoff Distribution. At the peak of a bullish trend, when individual investors feel the most hopeful, the "smart money" (major institutions and professionals) begins to quietly and strategically offload their positions during the buying frenzy. To the untrained eye, the market still looks strong, but beneath the surface, the energy is fading.
Grasping Wyckoff Distribution is akin to recognising when the celebration is concluding. It equips traders with a roadmap of how markets transition from euphoria to decline, helping you avoid being the last one holding overpriced assets and instead positioning yourself for the next big move down.
| Phase | What Happens | Volume Signature | Trader Watchpoint |
|---|---|---|---|
| PSY (Preliminary Supply) | First signs of heavy selling as institutions test the waters. | Volume spikes on down days. | Early warning: market may be topping. |
| BC (Buying Climax) | Price surges into a peak with excitement at its highest. | Sharp rise in volume. | Don’t chase the rally as smart money is selling. |
| AR (Automatic Reaction) | First sharp drop after BC as demand weakens. | Wide spread, strong volume. | Confirms buyers are losing control. |
| ST (Secondary Test) | Market retests the high but with weaker momentum. | Lower volume on rally. | A fading push as sellers are preparing. |
| UT/UTAD (Upthrust / After Distribution) | False breakout above resistance to trap late buyers. | Volume may increase, but rally fails. | Classic "bull trap" with potential short entry. |
| SOW (Sign of Weakness) | Strong down move breaking support zones. | Volume expands on declines. | Confirmation: sellers dominate. |
| LPSY (Last Point of Supply) | Weak rallies after breakdown, met with heavy selling. | Light volume up, heavy volume down. | Low-risk short setups. |

1) Preliminary Supply (PSY): Think of it as the first hint the party is ending as lights flicker, and the music dips, but most people ignore it. Institutions test selling pressure here.
2) Buying Climax (BC): The peak of excitement. Retail investors are elated, jumping in, as institutions discreetly sell off.
3) Automatic Reaction (AR): Like a sudden hush in the crowd, the market drops sharply, showing demand is drying up.
4) Secondary Test (ST): The market tries to retake the high but lacks strength. Think of someone trying to restart the party with no energy left.
5) Upthrust / UTAD: A deceptive move higher to lure in late buyers. Picture the DJ raising the volume for a final song, then abruptly stopping it.
6) Sign of Weakness (SOW): A decisive breakdown. Sellers clearly overpower buyers.
7) Last Point of Supply (LPSY): The final weak rallies before the real markdown begins. It is like stragglers lingering while the venue is closing.

After a sustained uptrend, large players look to sell without crashing the market.
The price oscillates sideways: the market is no longer trending up (this is the distribution range).
Upthrusts (UT/UTAD) push price above the range to trap breakout buyers. Volume behaviour reveals who's in control.
Price drops below the range with increased selling volume. This is the structural break toward markdown.
Any retracement that fails to reach previous highs is a second chance for shorts.

Distribution usually follows a visible rally on the higher timeframe (daily/weekly). Avoid invoking distribution within a minor corrective leg.
Rising volume on down legs and drying volume on rallies is the central confirmatory signal. If rallies occur on heavy volume, the range may be accumulation instead.
A false breakout above range highs on higher volume that quickly fails is a high-probability distribution signal.
Many Wyckoff traders wait for structural weakness (lower lows, expanding volume) before initiating aggressive shorts.
Confirm distribution structure on a higher timeframe; use lower timeframes (1H, 15m) for precise entries.
Listed below are verifiable and citable examples of traders applying the Wyckoff distribution
Following the 2021–23 rally, analysts and Wyckoff practitioners monitored a distribution-style range in mid-2024. Their public journals recorded PSY/BC/SOW events in real time. These pieces show how the Wyckoff map was applied to the S&P 500 structure.
In late 2024 and early 2025, crypto analysts highlighted looming Wyckoff distributions on BTC, annotating UTAD and SOW scenarios. Traders used these as guides to identify liquidity zones and potential markdowns.

Setup: Range after a clear uptrend; UTAD or failed breakout above range.
Entry: Short on confirmed SOW break (daily close below range) or on lower-timeframe LPSY failure (retest and fail). Conservative traders wait for a pullback into the broken range.
Stop: Above the highest recent UT/UTAD or above the local LPSY high. Keep it tight relative to structure.
Targets: Previous demand zones, measured range height projected downward, or point-and-figure targets (Wyckoff used P&F for objectives).
Position sizing note: Because distribution can produce whipsaws (false SOWs or retests that reclaim the range), keep size small (1–2% risk of equity) and scale in where permitted.
Small caps, illiquid crypto tokens, or late-session ETF slices may show fake distribution volume. Wyckoff relies on trustworthy volume data.
If the broader market has no directional pressure, distributions often produce repeated false breaks.
Markets with unusual order-book activity (some altcoins, cross-listed low-liquidity stocks) can invalidate Wyckoff volume rules.
Volume on down moves must be persistently stronger; a one-off spike doesn't confirm distribution. Always check higher timeframes.
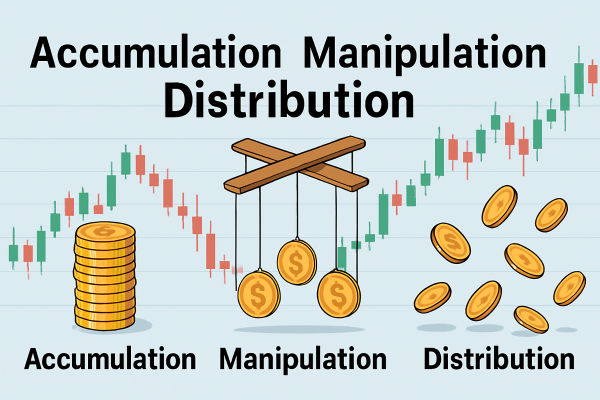
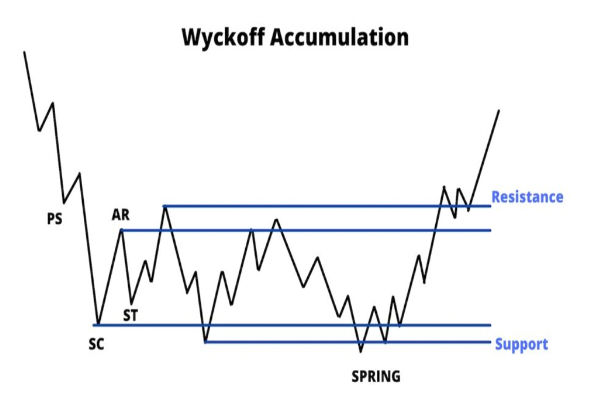
Distribution forms after a rally, marking supply dominance and a pending markdown. Accumulation occurs after a markdown, marking demand and a pending markup.
Wyckoff is a multi-timeframe method. Use weekly for context and daily for structural signals; intraday (1H/15m) helps refine entries.
Yes. Many traders map Wyckoff schematics to BTC/ETH.
Conservative approach: wait for SOW or a failed retest. Aggressive traders may short a clear UTAD failure, but the risk of a quick reversal is higher.
In conclusion, Wyckoff Distribution is not just a chart pattern; it's a psychological map of how markets shift from optimism to pessimism.
As you practice, remember this: markets move in cycles of accumulation → markup → distribution → markdown. Spotting distribution means you're reading the story in real time, before the big drop unfolds.
For beginners, the most crucial lesson is patience: don't rush to short the first sign of weakness. Instead, wait for confirmation through volume behaviour and structural breaks, such as the Sign of Weakness.
Disclaimer: This material is for general information purposes only and is not intended as (and should not be considered to be) financial, investment or other advice on which reliance should be placed. No opinion given in the material constitutes a recommendation by EBC or the author that any particular investment, security, transaction or investment strategy is suitable for any specific person.