Trading patterns are the foundation of technical analysis and a vital tool for traders seeking consistent profits in the financial markets. By recognising and acting on established chart patterns, traders can anticipate price movements, improve their timing, and manage risk more effectively.
Whether you are a beginner or an experienced trader, mastering these patterns can give you a significant edge. In this article, we explore the best trading patterns for consistent profits, how to identify them, and tips for using them successfully.
Why Trading Patterns Matter

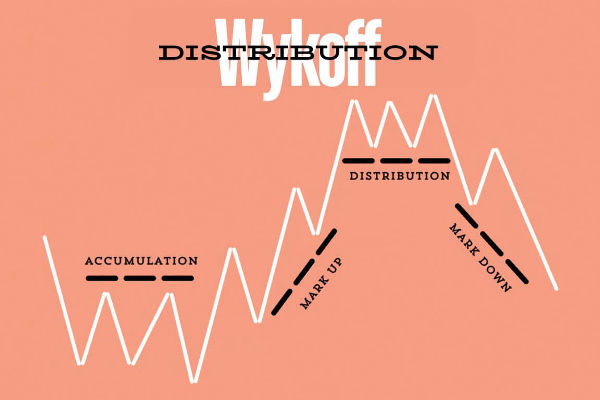
Trading patterns are visual representations of price action that reflect the psychology of buyers and sellers. They reveal periods of accumulation, distribution, trend continuation, and reversal.
By understanding these formations, traders can make more informed decisions about when to enter or exit trades, set stop-losses, and define profit targets. Patterns are not infallible, but when combined with sound risk management, they can greatly enhance the probability of success.
The Most Reliable Trading Patterns
1. Head and Shoulders & Inverse Head and Shoulders

Success Rate: Over 80% (statistically the most accurate)
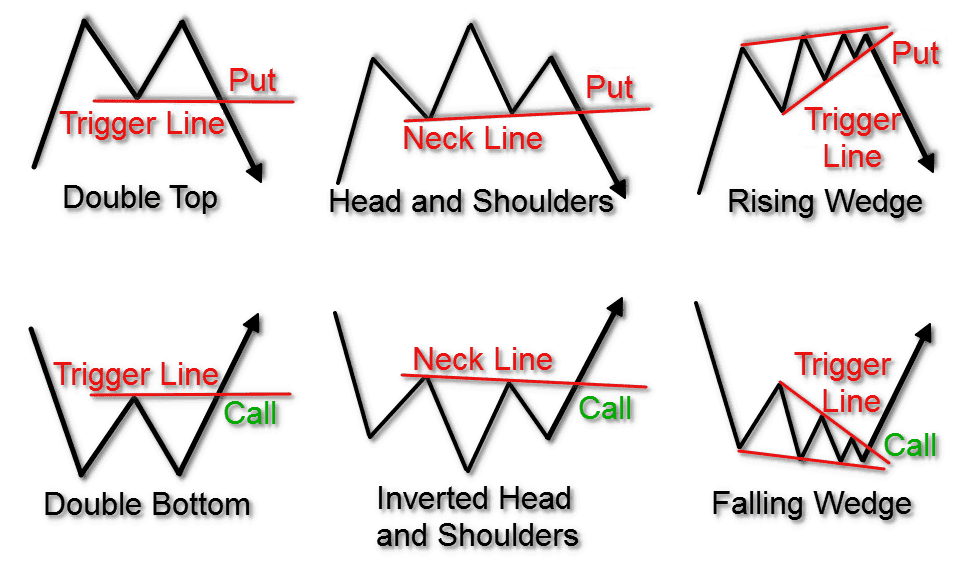
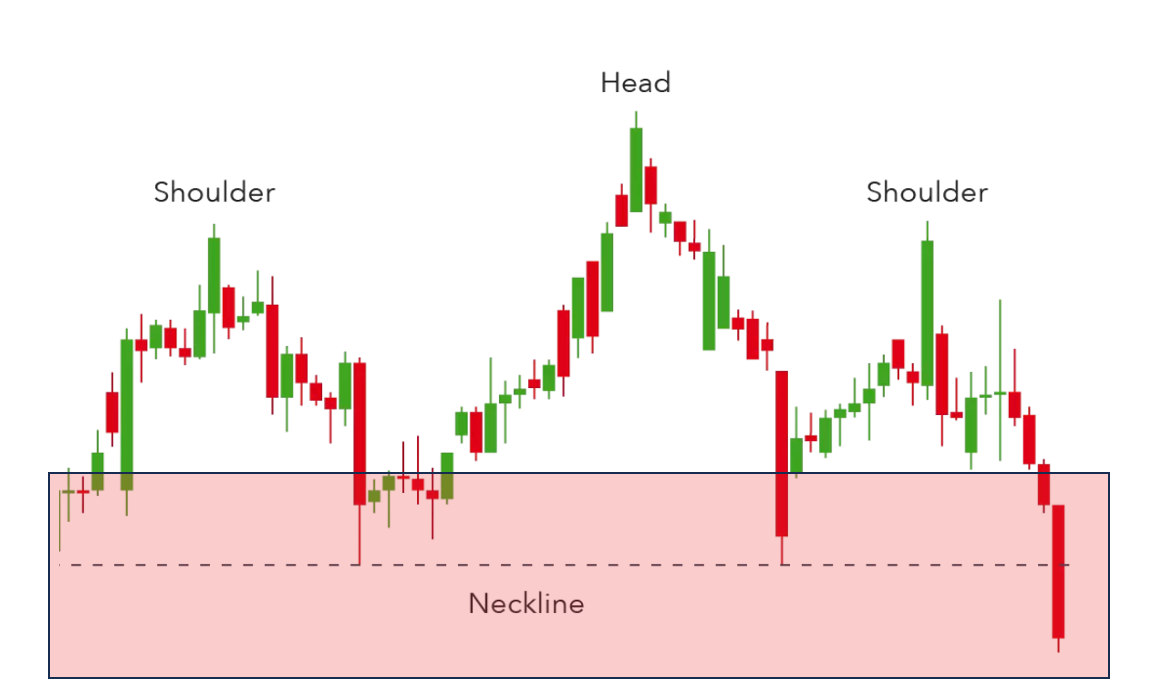
The head and shoulders pattern is a classic reversal formation. It consists of a peak (shoulder), followed by a higher peak (head), and then another lower peak (shoulder). The neckline connects the lows between the peaks. A break below the neckline signals a bearish reversal. The inverse version signals a bullish reversal when price breaks above the neckline.
How to trade:
Enter after a confirmed breakout of the neckline.
Place a stop-loss above (or below) the right shoulder.
Target a move equal to the distance from the head to the neckline.
2. Double Top & Double Bottom
Success Rate: Double bottom (78.6%), double top (75%)
These are powerful reversal patterns. A double top forms after an uptrend, with two peaks at a similar level, signalling a potential bearish reversal. A double bottom, seen after a downtrend, features two troughs at a similar level, indicating a bullish reversal.
How to trade:
Enter after price breaks the neckline (the low between tops or the high between bottoms).
Place a stop-loss just above (or below) the last peak/trough.
Target the height of the pattern from the neckline.
3. Triangles (Ascending, Descending, Symmetrical)
Success Rate: Ascending (72.8%), Descending (72.9%)
Triangles are continuation patterns that form during periods of consolidation. An ascending triangle features higher lows and a flat resistance line, often breaking out upwards. Descending triangles have lower highs and flat support, typically breaking downwards. Symmetrical triangles can break in either direction.
How to trade:
Enter on a confirmed breakout with increased volume.
Place a stop-loss just outside the opposite side of the triangle.
Target a move equal to the triangle's widest point.
4. Flags and Pennants
Flags and pennants are short-term continuation patterns following a strong price move (the flagpole). Flags are small rectangles that slope against the trend, while pennants are small symmetrical triangles. Both suggest the trend will resume after a brief pause.
How to trade:
Enter on a breakout in the direction of the prior trend.
Place a stop-loss below (or above) the flag or pennant.
Target a move equal to the flagpole's length.
5. Channels (Ascending & Descending)
Channels are parallel trendlines that contain price action, indicating a steady trend. An ascending channel signals a bullish trend, while a descending channel signals a bearish trend.
How to trade:
6. Cup and Handle
The cup and handle is a bullish continuation pattern. The “cup” is a rounded bottom, followed by a smaller consolidation (“handle”). A breakout from the handle signals the start of a new uptrend.
How to trade:
Enter on a breakout above the handle's resistance.
Place a stop-loss below the handle.
Target the depth of the cup added to the breakout point.
Tips for Trading Patterns Successfully
Wait for Confirmation: Always wait for a confirmed breakout or breakdown before entering a trade. Premature entries can lead to false signals.
Use Volume: Volume should increase on breakouts, confirming the pattern's validity.
Risk Management: Set clear stop-losses and use appropriate position sizing to protect your capital.
Combine with Indicators: Use moving averages, RSI, or MACD to confirm pattern signals.
Practise Patience: Let patterns fully form before acting. Rushed trades often lead to losses.
Backtest Your Strategy: Review past trades and test patterns on historical charts to build confidence and refine your approach.
Common Mistakes to Avoid
Ignoring Market Context: Patterns work best in trending markets. Avoid trading patterns in choppy or sideways conditions.
Overtrading: Not every pattern is worth trading. Be selective and focus on high-probability setups.
Neglecting Stop-Losses: Always protect your downside. Even the best patterns can fail.
Conclusion
Mastering trading patterns is a key skill for achieving consistent profits in the markets. While no pattern guarantees success, understanding and applying these proven setups—such as head and shoulders, double tops/bottoms, triangles, and flags—can significantly improve your trading results.
Combine pattern recognition with sound risk management and patience for the best chance of long-term success.
Disclaimer: This material is for general information purposes only and is not intended as (and should not be considered to be) financial, investment or other advice on which reliance should be placed. No opinion given in the material constitutes a recommendation by EBC or the author that any particular investment, security, transaction or investment strategy is suitable for any specific person.


