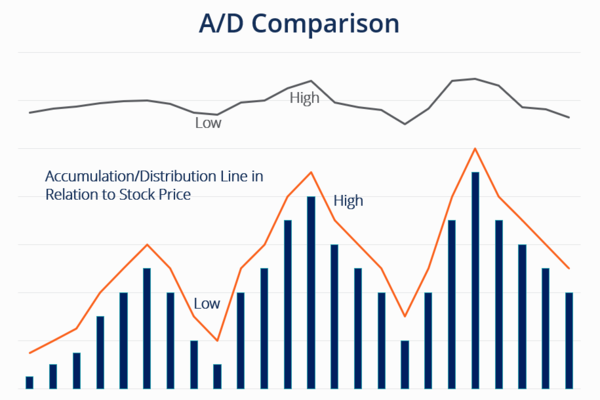
With the change of seasons, the weather fluctuates so much that people have to check the forecast daily to adjust their clothing. Similarly, the stock market is even more unpredictable, often causing frustration for traders. However, just as there is a weather forecast, the stock market has its own "forecasting tool"—the volume-price relationship. This is one of the most crucial indicators for predicting future trends.

It is a stock market term, where volume refers to a stock's turnover per unit of time and price refers to a stock's price. A stock price rises or falls with the size of the volume of the relationship between the existence of certain internal factors. Investors can analyze this relationship to determine the situation of buying and selling stocks. The basic principle is volume in price first; that is, all changes in stock prices must have volume first.
It has a variety of forms of expression, or, in short, the same direction and deviation of two kinds. Volume and price in the same direction: when the stock price and volume change in the same direction, it indicates that the current trend is stable, and the stock price, with the increase in volume and rise, is expected to continue to rise. The stock price with the volume decreased and fell to continue to fall the possibility of large volume and price divergence when the stock price and volume were the opposite of the trend of change.
Generally, to produce a new trend of signals, the stock price rose and volume gradually decreased, which shows the upward trend of the stock price. There is no volume to support the trend belonging to the untenable; investors should be doubly careful at this time. After a long period of decline in the stock price, volume rose, indicating that there was a new influx of funds, and then there was a reversal of the trend.
Diagram of 8 common forms Strong
Buying Power: volume is significantly enlarged, accompanied by a rise in share price. This indicates that the buyer force is strong, the market is bullish, and there may be a buy signal.
Strong Selling Power: Volume is clearly enlarged, accompanied by a decline in the stock price. This indicates a strong seller force; the market is bearish; this may be a sell signal.
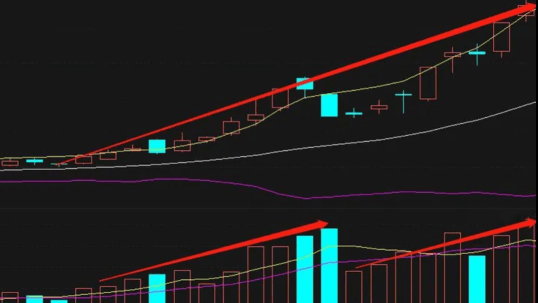
Volume and price rise: Volume and price rise at the same time, indicating a strong market trend that is expected to continue.
Top Divergence: A new high in the stock price but no significant increase in volume may be the top of the market signal; you need to be alert to a possible trend reversal.
Bottom Divergence: A new low in the stock price but no significant increase in volume may be a signal of a market bottom; be on the lookout for a possible trend reversal.
Consolidation period volume: in the market consolidation period, volume is relatively large, which may be a signal for market change. We need to pay attention to the trend that may occur.
Volume breakout: volume in the price breakout of the previous high point significantly enlarged may be the beginning of a new uptrend signal.
Shrinking volume finishing: in the market finishing period, volume gradually reduced, showing that the market wait-and-see may be a signal that the trend is about to occur.
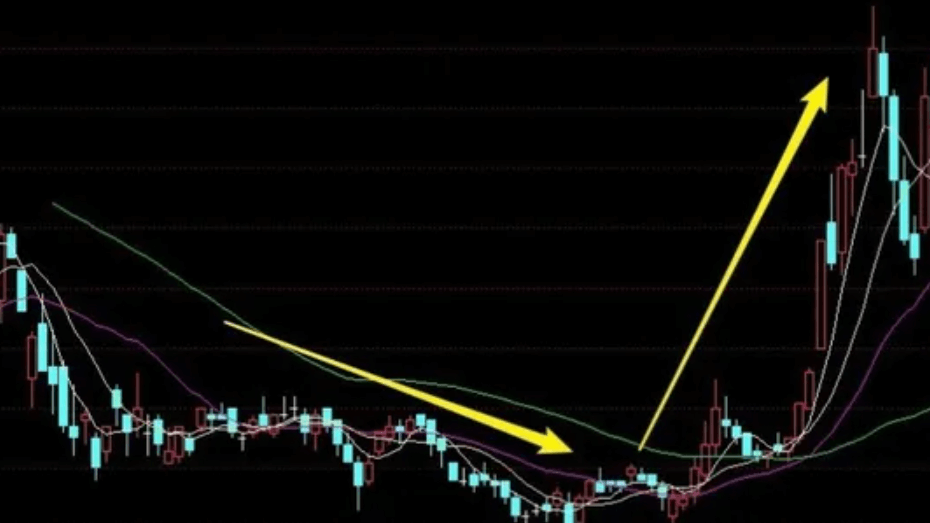
According to different patterns, investors can make more accurate judgments on the market based on these patterns in actual operation. It should be noted that these patterns are not absolute and should be analyzed in conjunction with other technical indicators and overall market conditions.
The Essence of the Volume-Price Relationship
As an integral part of stock market analysis, it provides investors with clues to market activity, strength, and potential trend turning points by observing the relationship between volume and stock price. The essence of it is this:
Firstly, volume can reflect the level of market activity. High volume indicates a high level of interest and activity among market participants, while low volume may indicate a wait-and-see or weak market. Volume is a key indicator of market activity.
Secondly, there is consistency between volume and stock price trends. In a strong trend, rising stock prices are usually accompanied by increased volume, while in a weak trend, falling stock prices are also usually accompanied by increased volume. This consistency provides investors with an important basis for trend reliability.
When a stock price is about to make a turnaround, an increase in volume may signal a trend turn. For example, an increase in volume but a drop in the share price may signal a market bottom, and vice versa. These turning points are important for both short-term trading and trend-following.
It is also useful to watch for divergences between volume and stock prices at tops and bottoms. Divergences may indicate a change in market forces and may signal a trend reversal. These divergence signals help investors spot potential trend changes.
Price jumps and volume changes are also areas of interest. A price jump is usually a reflection of a dramatic change in market participant sentiment, and an increase in volume may strengthen the reliability of the trend. In the event of a price breakout, an increase in volume may further confirm the reliability of the trend.
Also, volume breakouts and contraction consolidations are important volume-price relationship phenomena. A breakout on volume is usually a signal of the start of a new trend, while a contraction consolidation may indicate a market wait-and-see and the need to watch out for the possible onset of a trend. These phenomena provide investors with clues to trend changes.
Finally, it is also important to combine volume with changes in the stock price. Volume amplification should be in line with the upward or downward trend of the stock price in order to support the reliability of the trend. If volume is expanding and the stock price is not following, this could be a sign of a weak trend. At the same time, a combination of other technical indicators and analysis methods, such as moving averages and relative strength indicators, can provide a more comprehensive assessment of market conditions.
The essence of this is to reveal the market's internal dynamics and trends by taking a deeper look at the relationship between volume and stock price. This provides investors with more comprehensive market information and helps them make more accurate investment decisions.
Volume-price relationship ten mnemonic
| Pithy formula |
Explanation |
| Volume and price rise together |
Volume and price are going up together, strong market |
| Volume and price fall together |
Volume and price aligned, indicating a weak market. |
| Shrinkage breakthrough |
Volume is low as the stock price is rising. |
| Volume correction |
Volume is increasing on pullbacks, trend may continue. |
| Top departure |
Volume did not increase at new highs, watch out for top signals. |
| Bottom departure |
Volume did not increase at new lows, alert for bottom signal |
| The volume increases and the price flattens |
Increased volume, flat stock price, in a wait-and-see situation. |
| Reduce quantity and level price |
Decreasing volume, flat stock price, uncertain trend. |
| Reduction finish |
Volume gradually decreases during market consolidation |
| Volume lead |
Volume increases first and then the price rises |
How to Analyze Volume-price
This involves observing the relationship between share price movements and volume, which can be done in several steps:
Firstly, observe the changes in volume. Check the trend of volume, especially when there are important fluctuations in the share price. An increase in volume may indicate an increase in the activity of market participants, while a decrease in volume may indicate a wait-and-see or weak market.
Next, analyze the direction of volume. Focus on whether the volume is expanding or shrinking. In the case of a rising stock price, enlarged volume may indicate strong buyer power in favor of an uptrend. Conversely, volume that is enlarged but the stock price is falling may indicate strong seller power in favor of a downtrend.
It is also important to compare volume with the trend of the stock price. In an uptrend, volume rises with the stock price; in a downtrend, volume falls with the stock price. This consistency may indicate the reliability of the market trend.
Also, look for top and bottom divergences. When the stock price forms a new high or low, observe whether the volume is consistent with it. If volume does not enlarge accordingly, there may be a divergence, indicating that market forces may be weakening and that attention needs to be paid to possible reversal signals.
Also, watch for breakouts and pullbacks. Note whether the stock price breaks out of a key support or resistance level along with the volume build-up. A breakout with enlarged volume may signal a trend continuation; conversely, if volume is low, it may be a false breakout and requires caution. In addition, pay attention to how volume behaves when the stock pulls back to see if it enlarges, which may help determine the strength of the pullback and market sentiment.
Finally, watch for price jumps. When a stock price jumps, look for an increase in volume. Price jumps are usually accompanied by dramatic changes in market participant sentiment, and an increase in volume may reinforce the reliability of the trend.
Volume-price relationship analysis should be used in conjunction with other technical indicators, such as moving averages, the relative strength indicator (RSI), etc., to get a more comprehensive market analysis. It should be noted that its analysis is not absolute, and market conditions can be affected by a variety of factors. Therefore, it is best to combine it with other information to maintain caution and comprehensiveness when conducting analyses.
How to analyse the volume-price relationship
| Analyses |
Stocks Rising |
Stock price flat |
Stocks falling |
| Volume Increased |
Strong Market |
Volume increase and price flat |
Reversal possible |
| Volume flat |
Possible consolidation |
Wait and see |
Uncertain trend |
| Volume decrease |
Weak trend |
Reversal possible |
Weak Market |
What is the Signal of "Volume Increase and Price Flattening"?
"Volume up and price flat" indicates an increase in volume while the stock price is basically flat. This situation may indicate that there is some uncertainty in the market and investors are taking a wait-and-see approach to the current price level.
It is important to note that an increase in volume may indicate an increase in activity by market participants, but investors may be on the sidelines as the share price is relatively flat. This could be the result of the market waiting for some key information or event.
"An increase in volume and a flat price is not a clear buy or sell signal but may be a precursor to a trend turn. An increase in volume may signal a change in market sentiment, but it needs to be combined with other indicators and patterns to confirm a possible trend change.
A flat stock price may be due to a relative balance of power between buyers and sellers, with the market in a sideways or consolidation mode. At this point, it is necessary to pay close attention to subsequent price movements to confirm the market trend.
In the case of "volume increase and price flattening," investors may need to remain cautious and wait for more market signals or confirmation. At this time, other technical indicators or patterns can be combined to obtain more comprehensive market information.
Disclaimer: This material is for general information purposes only and is not intended as (and should not be considered to be) financial, investment, or other advice on which reliance should be placed. No opinion given in the material constitutes a recommendation by EBC or the author that any particular investment, security, transaction, or investment strategy is suitable for any specific person.


