Opening a company looks at cash flow; understanding macroeconomics looks at money flow; and the stock market looks at volume. In the financial market, the ups and downs of prices are inseparable from volume. In practical operation, the volume indicator is often used with the k-line average and other price indicators to predict the market but also to analyze the price trend of one of the important indicators.

What is a Volume Indicator?
Its English name is Volume Indicator, abbreviated as VOL. As an important market indicator, it can be used to analyze the strength and direction of trading activities. Volume also allows us to understand market sentiment, as if the k-line histogram reflects the change in market sentiment.
Volume refers to the total amount of a financial asset (such as stocks, futures, foreign exchange, etc.) traded in the market at a given time.Usually measured in trading units (shares, lots, contracts, etc.), it indicates the sum of all buying and selling transactions in a given time period.
The so-called transaction must be that buyers are optimistic that the market price will rise and sellers are bearish that the market price will fall, the two sides of the left side of the views of the parties to facilitate the transaction. Therefore, it is one of the most important indicators of market activity and trading strength. High volume usually reflects the increased interest and attention of market participants in a particular asset, which may be a signal of acceleration or reversal of the market trend. Low volume, on the other hand, may indicate that the market is relatively cold and investors are cautiously waiting to see what happens.
The simplest form of VOL is a volume chart, which shows how much of an asset has been traded over different time periods. It will be presented as a bar chart, which is colored to take into account the opening and closing prices, with green representing a rise and red a fall. If the stock price rises from $8 to $10 on the same day, it will be shown in green; if the stock price falls from $10 to $8 on the same day, it will be shown in red.
Volume that changes from large to small is called a contraction, and volume that changes from small to large is called an increase. Shrinkage refers to the market compared to the previous volume being significantly reduced; it indicates that the buyers and sellers are extremely light. generally divided into two situations. First, the market is bearish. To maintain this wait-and-see attitude, some people sell and no one buys.Second, the market is very optimistic about the stock market; some people buy without anyone to sell, and buyers and sellers cannot reach the transaction. Volume refers to the market compared to the previous significant increase, which indicates that buyers and sellers are more active. One part of the population sells in large quantities, while the other part of the population buys in large quantities, and the increase in volume is greatly increased in this regard.
Its relationship with price is known as the volume-price relationship, and different volume-price relationships in different markets convey different information. Generally speaking, the price rise needs support; it is the price upward ladder. However, the dealer, in wanting to ship out to clear the position, also went back and forth to sell the stock, create a false number of transactions, and attract retail investors on the hook.
Types of Volume Indicators
Volume indicators can be broadly classified into several types, each serving a unique purpose in technical analysis. Here are some of the most common types of volume indicators:
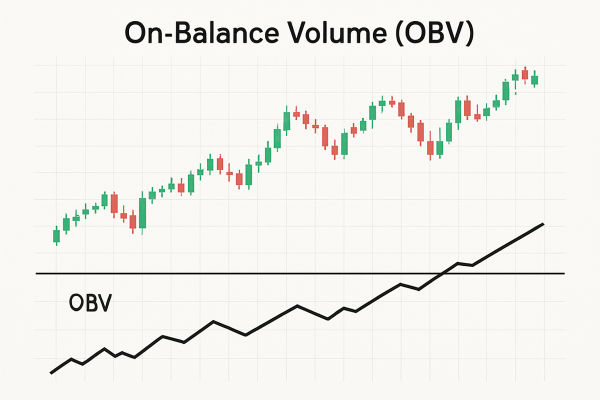
On-Balance Volume (OBV): This indicator measures the buying and selling pressure by comparing the volume on up days to the volume on down days. By tracking the cumulative volume, OBV helps traders understand whether the volume is flowing into or out of an asset, providing insights into future price movements.
Money Flow Index (MFI): The Money Flow Index (MFI) calculates the ratio of positive money flow to negative money flow, helping traders identify buying and selling pressure. By incorporating both price and volume data, the MFI provides a more comprehensive view of market sentiment and potential reversals.
Volume Weighted Average Price (VWAP): The Volume Weighted Average Price (VWAP) calculates the average price of an asset based on its trading volume. This indicator helps traders understand the market’s perception of value and is often used to confirm the direction of a trend or identify potential entry and exit points.
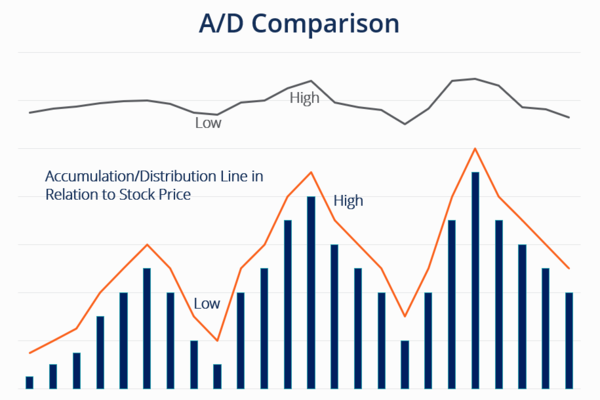
Accumulation/Distribution Line (A/D Line): The Accumulation/Distribution Line measures the cumulative flow of money into and out of an asset. By analyzing the relationship between price and volume, the A/D Line helps traders identify trends and potential reversals, making it a valuable tool in technical analysis.
Chaikin Money Flow (CMF): The Chaikin Money Flow (CMF) calculates the difference between the money flow on up days and down days. This indicator provides insights into buying and selling pressure, helping traders gauge the strength of a trend and identify potential turning points in the market.
What are the volume indicators?
| Indicators |
Abbreviations |
Brief description |
| Volume Histogram |
VOL |
A bar chart's height represents trading volume. |
| Relative Strength Indicator |
RSI |
Measures price and volume strength. |
| Accumulation/Dispatch Line |
ADL |
Observes line trend for market money flow. |
| Volume Relative Strength |
VROC |
Used to measure the rate of change in volume. |
| Open greater than previous day's close |
OBV |
Used to measure the strength of buyers and sellers. |
Understanding Volume Indicator in Trading
It contains different types of indicators, the most common of which are volume bar charts. Its height indicates the size of the volume, and generally speaking, an increase in volume is usually accompanied by a rise in price. Following this trend, a rising price with a rising volume represents an active market. Conversely, a falling price with rising volume may indicate a sluggish market.
By itself, it can't directly tell you whether to buy or sell because every transaction involves both buyers and sellers. However, by combining price action with volume, you can try to interpret market behavior and trends. In the case of rising prices, if the volume also increases, this could indicate strong support for the trend. Conversely, if it decreases when prices are rising, it may be a warning sign that the uptrend may lack support.
When prices make new highs or lows but the corresponding volume does not increase accordingly, there may be a price divergence. This may indicate that market participants' support for the current trend is weakening and a trend reversal may be occurring.
By looking at the volume histogram, you can see its relative size at different points in time. Larger bars indicate more intense trading activity during the corresponding time period. Some specific patterns may provide additional information, such as spikes, zoomed-in trading days, etc. These patterns may be associated with important turning points in the market.
It also contains a number of other indicators, such as the Relative Strength Indicator (RSI), Accumulation/Distribution Line (Accumulation/Distribution Line), Volume Relative Strength (VROC), and Open Bigger Than The Previous Day's Close (OBV). The RSI varies from 0 to 100. Typically, an RSI value above 70 may indicate that the market is overbought and a price decline may occur. An RSI value below 30 may indicate that the market is oversold and a price increase may occur.
Accumulation and dispatch line trends can be used to determine market strength. An upward trend may indicate market accumulation, and a downward trend may indicate market dispensation. Signals that form trend consistency with the price chart may signal a buy or sell.
Positive values of VROC indicate an increase in volume, while negative values indicate a decrease in volume. Changes in relative strength can be used to measure market momentum. For example, a positive VROC may indicate that the market is in an uptrend phase. Positive OBV values indicate accumulation, and negative values indicate dispatches. OBV forms trend-consistent signals with price charts and can be used to confirm the reliability of a trend.
When looking at VOL, the key is to combine it with price charts and other technical indicators. For example, does an upward or downward price trend coincide with an increase or decrease in volume? It is also important to consider the overall context of the market, the trend, and key support and resistance levels.
Volume Indicator Strategies
Volume indicators can be used in various trading strategies to confirm trends, identify reversals, and gauge market sentiment. Here are some common volume indicator strategies:
Trend Confirmation: Use volume indicators to confirm the strength of a trend. For example, if the price rises and the OBV increases, it confirms the uptrend. This strategy helps traders ensure that the trend is supported by strong buying pressure, reducing the risk of false signals.
Reversal Identification: Use volume indicators to identify potential reversals. For example, if the price is rising but the MFI is falling, it may indicate a potential reversal. This strategy helps traders spot early signs of a trend change, allowing them to adjust their positions accordingly.
Breakout Confirmation: Use volume indicators to confirm breakouts. For example, if the price breaks out above a resistance level and the VWAP is also increasing, it confirms the breakout. This strategy helps traders validate the strength of a breakout, increasing the likelihood of a successful trade.
Mean Reversion: Use volume indicators to identify mean reversion opportunities. For example, if the price is overbought and the A/D Line is falling, it may indicate a potential mean reversion. This strategy helps traders capitalize on price corrections, providing opportunities to enter or exit trades at more favorable prices.
How to understand the volume indicator
| Indicators |
Type |
Observation |
| Volume Histogram |
Base |
Bar height: Up signals price rise, down signals price fall. |
| Relative Strength Indicator |
Oscillating |
RSI above 70: Overbought. RSI below 30: Oversold. |
| Accumulation/Dispatch Line |
Momentum |
Line up: Market accumulates. Line down: Market dispenses. |
| Volume Relative Strength |
Momentum |
Positive values: more volume; Negative values: less volume. |
| Open greater than previous day's close |
Momentum |
Confirms prices and signals trend consistency. |
Volume Indicator Formula
Relative Strength Indicator (RSI): RSI = 100 - (100/(1+RS)), where RS (Relative Strength) = average volume on an average growth day and average volume on an average down day.
Accumulation/Dispatch Line: Volume for the day plus (Close of the day, Low of the day) minus (High of the day, Close of the day)
Volume Relative Strength (VROC): VROC=((Volume of the day - Volume of n days ago)/Volume of n days ago)*100
Open greater than the previous day's close (OBV):
The change in OBV is determined by comparing the day's close to the previous day's close:
If the day's close is greater than the previous day's close, OBV = the previous day's OBV + the day's volume.
If the day's closing price is less than the previous day's closing price, then OBV = the previous day's OBV minus the day's volume.
If the day's closing price is equal to the previous day's closing price, the OBV remains unchanged.
Choosing the Best Volume Indicator
Choosing the best volume indicator depends on your trading strategy, market conditions, and personal preferences. Here are some factors to consider:
Market Conditions: Different volume indicators perform better in different market conditions. For example, the OBV performs well in trending markets, while the MFI performs well in ranging markets. Understanding the current market environment can help you select the most appropriate volume indicator.
Time Frame: Different volume indicators are suitable for different time frames. For example, the VWAP is suitable for short-term trading, while the A/D Line is suitable for long-term trading. Consider your trading horizon when choosing a volume indicator to ensure it aligns with your strategy.
Trading Strategy: Different volume indicators are suitable for different trading strategies. For example, the CMF is suitable for trend-following strategies, while the OBV is suitable for mean reversion strategies. Match the volume indicator to your trading approach to enhance its effectiveness.
Personal Preferences: Ultimately, the best volume indicator is the one that you are comfortable using and that fits your trading style. Experiment with different indicators to find the one that resonates with you and provides the most valuable insights for your trading decisions.
By considering these factors, you can choose the best volume indicator for your trading needs and improve your trading performance.
Disclaimer: This material is for general information purposes only and is not intended as (and should not be considered to be) financial, investment, or other advice on which reliance should be placed. No opinion given in the material constitutes a recommendation by EBC or the author that any particular investment, security, transaction, or investment strategy is suitable for any specific person.


