Gross Domestic Product (GDP), also known as GDP, is commonly referred to in news. Officially, GDP refers to the total value of all goods and services in a country or region over a certain period of time (usually referring to an annual or quarterly period), expressed in currency. This mainly reflects the overall economic performance of a country or region. Gross domestic product includes consumption, private investment, government expenditure, and net exports. Here is a formula to remember:
GDP=C1+I+C2+X
C1 represents consumption; I represents dead person investment; C2 represents government expenditure; X represents the net export amount.
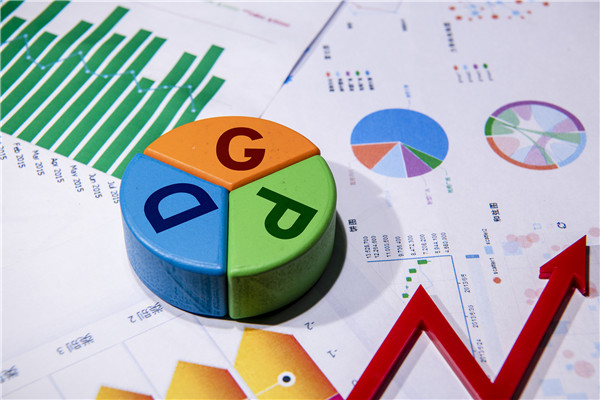
Generally speaking, whether a country's economy is prosperous, whether national income has increased, and consumption capacity will be displayed in GDP. If a country's GDP increases significantly, then all three aspects of the economy are developing in a positive direction.
But it does not necessarily mean that this development is good. Generally, to a certain extent, the national central bank will raise interest rates and tighten the money supply. If the country's economy performs well and interest rates rise, it will enhance the attractiveness of the country's currency. Therefore, the demand for the country's currency will increase, and the currency will appreciate. On the contrary, if GDP shows negative growth, it indicates that the economy is in a state of recession, and the national consumption capacity decreases. As a result, the demand for the country's currency also decreases, leading to a depreciation of the country's currency. In general, high economic growth will drive the exchange rate of the domestic currency to rise, and vice versa.
It should be noted that GDP is published in two forms: total amount and percentage rate. When the growth number is positive, it indicates that the country's economy is in a stage of expansion; On the contrary, if the growth number is negative, it indicates that the country's economy is in a period of recession. Let's take the United States as an example to illustrate:
The United States releases GDP data information in the third week of each month.
If the value increases compared to the same period last year, it indicates that the current economic development is accelerating, which is conducive to the appreciation of the US dollar;
If the value decreases compared to the same period last year, it indicates that the current economic development is slowing down and there is pressure for the US dollar to depreciate.
If the US GDP maintains a growth rate of 3%, it indicates that it is in an ideal state. The data from the end of August 2017 showed that the GDP growth rate had reached 3%, which alone restored confidence to President Trump, who had a relatively weak political record. Because a GDP growth rate of 3% in the United States is an ideal state, indicating that economic development is healthy. If the growth rate is higher than this value, it indicates that there is currently inflation pressure; If the growth rate is lower than this value, it indicates that the economy is currently slowing down and there are signs of entering a recession.
For example, in the mid to late 1990s, the average annual GDP growth rate in the United States was 4.1%, while the GDP growth rate in most countries in the eurozone was around 2%. For example, the average annual GDP growth rate in France was 2.2%, and the average annual GDP growth rate in Italy was around 1.2%. Compared to the average annual growth rate of the United States, it is almost half lower, which has led to a continuous decline in the exchange rate of the euro against the US dollar since its launch in 1999. In less than two years, it plummeted from 1.1900 to 0.8230, a depreciation of 30%.
In fact, the impact of differences in economic growth rates on exchange rate fluctuations is multifaceted, for three reasons:
One is that a country's high economic growth rate means an increase in income and an increase in domestic demand, which will increase the country's imports and lead to a current account deficit, which will cause the domestic currency exchange rate to decline.
Secondly, if the country's economy is export-oriented and economic growth is aimed at producing more export products, the growth of exports will compensate for the increase in imports and alleviate the pressure of the domestic currency exchange rate decline.
Thirdly, a country's high economic growth rate means an increase in labor productivity and a decrease in costs, while also improving the competitiveness of its own products, which is conducive to increasing exports and suppressing imports; And due to the high economic growth rate, the country's currency is also favored in the foreign exchange market, resulting in an upward trend in its currency exchange rate.
In the United States, the Department of Commerce is responsible for analyzing and calculating the gross domestic product, and the convention is to estimate and count it quarterly. After publishing the preliminary estimated data, there will be two revisions and announcements. Gross domestic product is usually used to compare with the same period last year. If there is an increase, it represents a faster economy and is conducive to Currency Appreciation; If it decreases, it indicates an economic slowdown and there is pressure for its currency to depreciate. For the United States, a growth rate of 3% in gross domestic product is an ideal level, indicating that economic development is healthy; But above this level indicates inflationary pressure, while growth below 1.5% indicates an economic slowdown and signs of entering recession.
When understanding GDP, one should know that GDP is not accurate. GDP reflects the overall and total amount of the national economy. In reality, the national economy is always in constant change. There are always some emerging industries and enterprises that are difficult to be included in the national accounts due to the non-standard statistics of their short history. For example, the current economic activities such as technical consulting industry, business services industry, entertainment industry are difficult to be accurately included in the GDP accounting, so the GDP at any time point can only be relatively accurate data. Due to the continuous standardization of emerging industries and enterprises and the continuous improvement of accounting conditions, the historical GDP data will often make some necessary adjustments, which is a special phenomenon of national accounts.
【 EBC Platform Risk Reminder and Disclaimer 】: There are risks in the market, and investment needs to be cautious. This article does not constitute investment advice.


