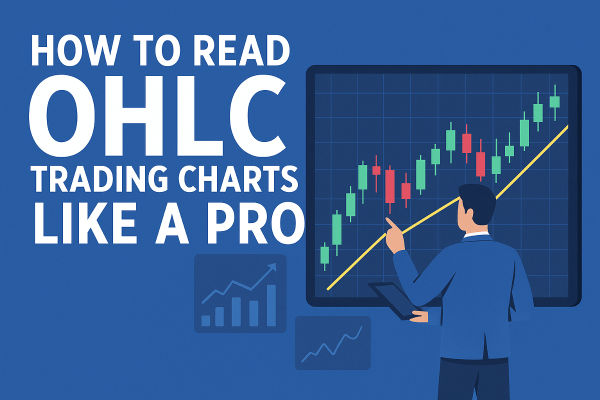
Published on: 2025-03-28
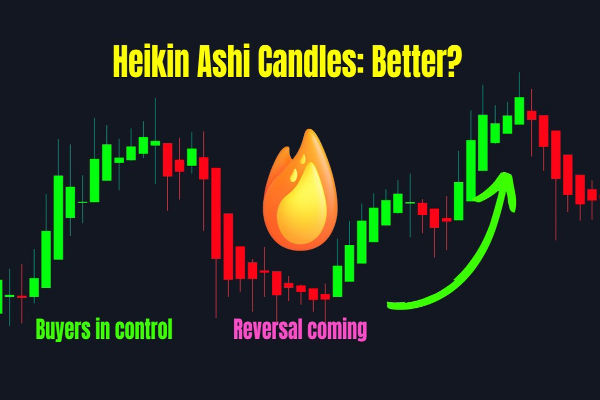
Heikin Ashi is a unique type of candlestick chart that helps traders analyse trends more effectively. Unlike traditional candlesticks, which show price fluctuations with each session, Heikin Ashi smooths out price action, making it easier to identify trends. This technique reduces market noise and allows traders to focus on an asset's broader movement.
For context, "Heikin Ashi" comes from Japanese, meaning "average bar," which reflects its core principle — using an average of past prices to create a more stable chart. This method is widely used in forex and stock trading, helping traders make informed decisions without being misled by short-term price volatility.

Heikin Ashi modifies standard candlestick charting using a unique formula to calculate candlestick values. The key difference between it and traditional candlesticks is how the open, close, high, and low values are calculated.
Open Price= (Previous Heikin Ashi Open + Previous Heikin Ashi Close) ÷ 2
Close Price = (Open + High + Low + Close) ÷ 4
High Price= The highest value among the Open, Close, and High of the current period
Low Price = The lowest value among the Open, Close, and Low of the current period
By averaging the price movements, the candlestick eliminates erratic price swings, allowing traders to focus on the overall trend. It makes it a valuable tool for spotting bullish and bearish phases without being distracted by market volatility.
Reading Heikin Ashi charts is also simple once you understand how they work. For example:
Bullish Trends: When the candles are green (or white, depending on the chart settings) with little to no lower shadows, it indicates a strong uptrend.
Bearish Trends: When the candles are red (or black) with little to no upper shadows, it signals a downtrend.
Trend Reversals: Candles with small bodies and upper and lower shadows often indicate a potential trend reversal.
Let's take a hypothetical example to understand how to calculate Heikin Ashi candles. Suppose we have the following traditional candlestick price data for a stock:
| Period | Open Price |
Close Price | High Price | Low Price |
| 1 | 100 |
102 | 105 | 98 |
| 2 | 102 | 107 | 108 | 101 |
| 3 | 107 | 109 | 110 | 106 |
Now, we will calculate the Heikin Ashi values using the formula above.
1) Calculate the First Candle
Since this is the first period, we assume the Heikin Ashi Open is the same as the traditional Open (100).
Open Price = (100 + 101.25) ÷ 2 = 100.625
Close Price= (100 + 105 + 98 + 102) ÷ 4 = 101.25
High Price = Max(105, 100.625, 101.25) = 105
Low Price = Min(98, 100.625, 101.25) = 98
2) Calculate the Second Candle
Using the first candle's open and close, we proceed with the second period:
Open Price = (100.625 + 101.25) ÷ 2 = 100.9375
Close Price = (102 + 108 + 101 + 107) ÷ 4 = 104.5
High Price = Max(108, 100.9375, 104.5) = 108
Low Price = Min(101, 100.9375, 104.5) = 100.9375
3) Calculate the Third Candle
Using the second candle's open and close:
Open Price = (100.9375 + 104.5) ÷ 2 = 102.71875
Close Price = (107 + 110 + 106 + 109) ÷ 4 = 108
High Price = Max(110, 102.71875, 108) = 110
Low Price = Min(106, 102.71875, 108) = 102.71875
4) Analyse the Final Value
| Period |
Open Price |
Close Price | High Price | Low Price |
| 1 | 100 |
101.25 |
105 | 98 |
| 2 | 100.9375 |
104.5 | 108 | 100.9375 |
| 3 | 102.71785 | 108 | 110 | 102.71875 |
This smoothing effect in Heikin Ashi makes trends clearer compared to traditional candlesticks. The values demonstrate how the candlestick removes market noise and provides a better picture of the overall trend.
One of the primary uses of Heikin Ashi is trend identification. By looking at the colour and structure of the candles, traders can determine whether an asset is in an uptrend, downtrend, or period of consolidation.
Strong Uptrends: A series of consecutive green candles with little to no lower shadows indicate strong bullish momentum. Traders can look for these signals to enter long positions.
Strong Downtrends: A series of red candles with little to no upper shadows suggests strong bearish momentum. It indicates that traders should consider shorting the asset or exiting long positions.
Sideways Markets: When the candles frequently alternate between red and green, it suggests market indecision and a lack of clear direction. It is often a time to avoid trading until a new trend emerges.
By focusing on these patterns, traders can make more accurate predictions about future price movements and avoid unnecessary losses.

1) Trend-Following Strategy
One of the simplest ways to use Heikin Ashi is to follow the trend. When a series of green candles appear without lower shadows, traders can enter long positions and hold until red candles start forming.
Similarly, when red candles dominate without upper shadows, traders can initiate short positions and stay in the trade until a reversal signal appears.
2) Reversal Trading Strategy
Heikin Ashi is also applicable for spotting potential reversals. When a strong uptrend suddenly shifts to small-bodied candles with both wicks, it may indicate weakening momentum and a possible trend reversal. Traders can use this signal to prepare for a shift in market direction.
3) Support and Resistance Strategy
Furthermore, you can use this candlestick with support and resistance levels to find high-probability trade setups. Traders can use horizontal support and resistance zones to identify key price levels where trends may pause or reverse.
If the candlestick confirms an uptrend near a strong support level, it increases the likelihood of a successful long trade. Conversely, if a downtrend is confirmed near resistance, traders can consider entering short positions.
4) Using Other Indicators
Moving Averages: Simple moving averages (SMA) and exponential moving averages (EMA) work well with Heikin Ashi. A common strategy is to use a 50-day SMA or EMA to confirm the trend. When the candles remain above the moving average, it signals bullish momentum, whereas candles below the moving average indicate bearish momentum.
MACD (Moving Average Convergence Divergence): MACD is a powerful momentum indicator that complements the candlestick. When the MACD line crosses above the signal line while Heikin Ashi shows a bullish trend, it confirms buying strength. On the other hand, a bearish Heikin Ashi trend combined with a MACD crossover below the signal line suggests selling opportunities.
RSI (Relative Strength Index): RSI is an essential indicator for identifying overbought and oversold conditions. If the candles are green and the RSI remains above 50, it confirms a strong uptrend. However, if RSI reaches 70 or higher, traders should be cautious of potential overbought conditions and prepare for a reversal. Similarly, if RSI drops below 30 while the candle remains red, it signals oversold conditions, which may indicate a buying opportunity.
Considering everything, Heikin Ashi is a valuable tool for traders looking to simplify market analysis and spot trends. By smoothing out price action and reducing market noise, beginners can benefit greatly, as it provides a clear and structured way to analyse price movements.
As beginner traders gain experience, they can refine their strategies by incorporating additional technical tools and adjusting their approach to different market conditions.
Disclaimer: This material is for general information purposes only and is not intended as (and should not be considered to be) financial, investment or other advice on which reliance should be placed. No opinion given in the material constitutes a recommendation by EBC or the author that any particular investment, security, transaction or investment strategy is suitable for any specific person.