Published on: 2025-04-17
Updated on: 2025-10-07
When navigating the forex market, indicators are like maps. Some give you a broad outline, while others zoom in on detail. Among the most trusted “maps” are the Envelope Indicator and Bollinger Bands.
Both are volatility-based tools built around moving averages, helping traders spot overbought and oversold conditions before the crowd reacts. They share the same foundation but take different paths.
This article breaks down how they work, their strengths, and how to decide which fits your strategy in forex trading.
The Envelope Indicator is one of the simpler tools in technical analysis, but don’t let that fool you as it can be very effective when used correctly.

At its core, it takes a moving average, usually a Simple Moving Average (SMA), and plots two lines above and below it at a fixed percentage. These lines create a price “envelope,” showing when the market drifts too far from its average.
Think of it like a rubber band around price. Most of the time, price moves inside the band. But when it stretches too far in either direction, the indicator signals the market may be overextended and ready to snap back.
This makes it especially useful in sideways markets, where mean reversion strategies shine.
The envelope indicator is simple and steady, making it useful for spotting reversals in calm markets. But its fixed settings can limit flexibility in volatile conditions.
| Pros | Cons |
|---|---|
| Simple and easy to understand with fixed percentage settings | Bands are static and don’t adapt to volatility |
| Works across multiple timeframes and markets | Less responsive in fast-moving or volatile conditions |
| Useful for spotting reversals in range-bound markets | Requires careful tuning as wrong settings reduce effectiveness |
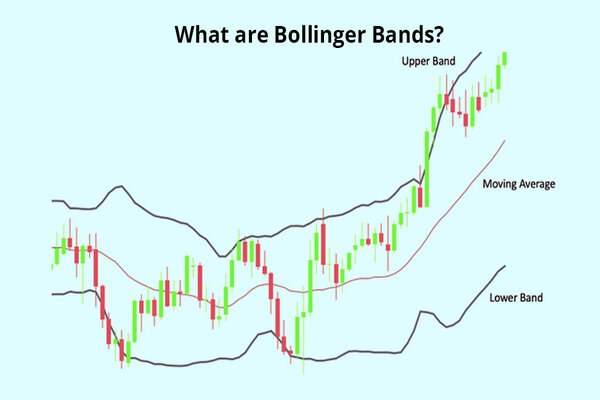
Bollinger Bands, created by John Bollinger in the 1980s, are another popular volatility tool, but with a clever twist. Like envelopes, they start with a moving average at the center.

The difference lies in the outer bands. Instead of a fixed percentage, Bollinger Bands use standard deviation, which means the bands “breathe” with the market.
When volatility rises, the bands widen, almost like the market taking a deep breath before a big move. When volatility falls, they tighten, signaling calmer conditions.
This dynamic quality makes them useful for spotting breakouts, gauging trend strength, or confirming when prices may be stretched into overbought or oversold zones.
Bollinger Bands adapt to market volatility, giving traders dynamic signals. However, they can be more complex and sometimes produce false alerts.
| Pros | Cons |
|---|---|
| Dynamic bands that adjust in real time to volatility | More sensitive to price swings, leading to false signals |
| Effective for spotting trends, breakouts, and momentum shifts | Requires deeper knowledge of volatility and standard deviation |
| Widely available on trading platforms and well-researched | Can lead to “crowded trades,” as many traders use them |
Both indicators use a moving average as the core, but their band calculations and best uses differ. Here’s how they compare:
| Feature | Envelope Indicator | Bollinger Bands |
|---|---|---|
| Band Calculation | Fixed percentage above and below moving average | Standard deviation from moving average |
| Sensitivity | Less sensitive to volatility | Highly sensitive, adjusts with volatility |
| Market Suitability | Works best in stable, sideways markets | Performs better in trending or volatile markets |
| Band Behavior | Remains static regardless of volatility | Expands and contracts with market conditions |
There’s no universal winner. The right tool depends on your style and the market.
Choose the Envelope Indicator if you want fixed price boundaries and trade in range-bound conditions.
Pick Bollinger Bands if you focus on volatility-driven signals or trend breakouts.
The best approach is to test both on demo accounts or historical data and see which aligns with your strategy.
The envelope works best for mean-reversion strategies in sideways markets. It highlights turning points where price may snap back toward the average.
Short-term traders also like its predictability. Since the bands stay fixed until you adjust them, planning entry and exit points is straightforward.
For stronger signals, pair the envelope with RSI or MACD to confirm setups and filter out false moves.
Bollinger Bands shine in markets with frequent surges and pullbacks. If your strategy involves riding trends or capitalizing on volatility, they give a clearer picture of price action.
One of their most powerful signals comes from a “squeeze.” When the bands narrow tightly, a breakout is often near. A sharp move beyond the bands after a squeeze can mark the start of a new trend.
For better accuracy, combine Bollinger Bands with volume indicators or candlestick patterns. This helps confirm breakouts and refine entry timing.
Yes, many traders combine the envelope indicator and Bollinger Bands for a fuller market view. The envelope provides a steady baseline, while Bollinger Bands adjust dynamically with volatility. Used together, they can highlight consistent price boundaries as well as sudden shifts.
The key is balance. Too many overlapping signals can easily create noise instead of clarity. Always make sure the indicators you choose complement one another and confirm the same story.
That way, you avoid confusion and build a stronger, more reliable strategy.
Bollinger Bands are generally more responsive in trending or volatile markets because they adjust dynamically to price volatility using standard deviation. Envelope indicators, with fixed bands, may lag behind rapid price movements.
Yes. Many traders use both: the Envelope gives a steady reference level, while Bollinger Bands show real-time volatility shifts. The trick is to avoid conflicting signals by choosing complementary settings.
Bollinger Bands: 20-period simple moving average with ±2 standard deviations.
Envelope Indicator: usually set at ±1–3% above and below a moving average.
Yes, especially in choppy or sideways markets. Because the bands react to volatility, rapid price swings may trigger false breakouts. That’s why Bollinger Bands are often used as a confirmation tool, not a standalone signal.
Envelope indicators tend to work better in range-trading conditions because their fixed bands provide consistent reference points. Bollinger Bands can “squeeze” in tight ranges, which may still offer signals, but the noise level rises.
Both the envelope indicator and Bollinger Bands are long-standing tools in technical analysis. Each comes with its own strengths and limitations. The real advantage lies in knowing when and how to apply them.
Instead of asking which one is universally better, focus on which aligns with your trading style. Consider the type of market you are trading in. Matching the indicator to the context often produces better results.
With practice, combining both can give you the extra edge. Sometimes the best strategy is not choosing one, but using them together.
Disclaimer: This material is for general information purposes only and is not intended as (and should not be considered to be) financial, investment or other advice on which reliance should be placed. No opinion given in the material constitutes a recommendation by EBC or the author that any particular investment, security, transaction or investment strategy is suitable for any specific person.