It is said that one of the significant differences between humans and other animals is their ability to use tools, and this is true. Whether in everyday life or in the professional world, tools help us solve problems. And in the trading market, there is a particularly effective tool—the DiNapoli Method. If you can make good use of this tool, you can significantly improve your trading results in practice. In the next section, we'll take a closer look at the DiNapoli Method and how it can be flexibly applied.

What is the DiNapoli Trading Method?
Also known as the DiNapoli Pip Trading Method, it is a highly accurate trading method created by Mr. Joel Dinapoli, one of the world's leading investment trading gurus. This method is designed to provide accurate market entry and exit signals through a clever combination of high-quality leading and lagging indicators.
The DiNapoli Method is a comprehensive trading system that consists of six main indicators that are divided into two main categories: judging trends and judging pips. The Trend section consists of two leading indicators and two lagging indicators, which are used to help traders accurately determine the overall trend of the market.
Specifically, the leading indicators in the DiNapoli trading method include the replacement moving average and the oscillator predictor. These tools play a vital role in market analysis. Moving averages help traders anticipate potential market movements by adjusting moving averages to future time periods, thus gaining a forward-looking perspective on future market changes.
The oscillator predictor further enhances the ability to predict future market movements by using complex mathematical models and calculations to forecast price fluctuations and trend changes in the market. The combination of these leading indicators allows traders to get a handle on potential trading opportunities before market movements are actually visible.
Lagging indicators, on the other hand, consist of a combination of stochastic and MACD indicators, which are primarily used to confirm actual market trends and Trading signals. Stochastic helps to identify overbought or oversold conditions in the market, and combined with the macd indicator's analysis of market momentum, the reliability of market signals can be effectively verified. This combination of lagging indicators enables traders to make more accurate trading decisions based on confirmation of market trends.
In terms of determining pips, the DiNapoli method utilizes two key indicators, the gold overlay and the logical profit target. The Gold Overlay provides traders with a scientific framework for identifying key price levels in the market by using advanced Fibonacci methods to accurately calculate areas of support and resistance.
The DiNapoli Trading Method helps traders accurately identify the best entry and exit points to take advantage of trading opportunities during market volatility. Logical profit targets are based on historical market data and predictive modeling and provide traders with reasonable profit targets to ensure that they are successful when the market reaches a predetermined price. The combination of the two provides traders with comprehensive pip analysis and decision support.
Logical profit targeting is the use of accurate market analysis and calculations to set reasonable profit targets for traders to ensure that profits are realized in a timely manner when the price reaches the desired level. Combined with historical market data and predictive modeling, logical profit targets provide clear profit targets, helping traders to act quickly when prices hit pre-set levels, thus increasing success rates and optimizing the timing of profit locks.
The combination of this range of high-quality indicators allows the DiNapoli trading method to demonstrate superior accuracy and efficiency in complex market environments. By combining advanced lagging indicators with precise leading indicators, the methodology forms a unique and systematic trading system.
The system not only covers advanced overbought and oversold analysis but also introduces nine directional graphical patterns. The overbought and oversold analysis provides signals that the market is too hot or too cold, helping traders to identify potential reversal points, while the nine directional graphical patterns further refine the market trend and enhance the grasp of market dynamics. The combined application of these elements makes trading decisions more precise and efficient.
The DiNapoli Trading Method is comprehensive and sophisticated, helping traders make accurate decisions in complex markets. By combining advanced leading and lagging indicators, golden ratio support and resistance analyses, and scientific stop-loss and take-profit targets, traders are able to accurately identify the best times to enter and exit trades. This approach not only optimizes trading positions but also enables robust trading strategies in changing market conditions.

Understanding DiNapoli Trading Method
The DiNapoli Trading Method provides a systematic framework for in-depth analysis of market trends and price levels by combining Fibonacci retracement and extension levels, price behavior analysis, and other technical indicators. This approach not only helps traders to identify key support and resistance levels but also to anticipate potential price targets, leading to a clearer and more efficient Trading plan. With this framework, traders can systematically assess market conditions, make more accurate trading decisions, and optimize their overall trading strategy.
Secondly, it also has the advantage of multiple confirmations. By combining Fibonacci retracement and extension levels with other technical indicators such as moving averages, RSI, and MACD, more confirmation signals can be provided. This mechanism improves the reliability of trading decisions and helps traders to more accurately identify key support and resistance levels in the market, thus optimizing trading strategies and risk management and improving success rates.
At the same time, the DiNapoli Pips tool helps traders identify key support and resistance levels in the market through precise calculations and analyses. These key levels are particularly important during market rallies or breakouts, as they mark areas of potential price reversals or continuing trends.
By effectively applying these support and resistance points, traders are able to more accurately predict the direction of market movements and important price levels and thus make more informed decisions when developing trading strategies. This not only improves trading accuracy but also enhances a trader's ability to respond in a dynamic market environment.
The DiNapoli method is highly adaptable and can be used in a wide range of financial markets, including equities, forex, and futures. This method is not only applicable to different market types but also has the flexibility to be adapted to different time frames, such as Intraday Trading, swing trading, etc., depending on the trader's needs and strategy.
Whether you are looking for a quick trading opportunity in the short term or a solid investment plan over a longer time period, the DiNapoli Pip Trading Method provides effective analytical tools and strategic support to help traders make accurate decisions in a volatile market environment.
Of course it has its drawbacks. The Diaboli method requires a high level of experience as it involves complex technical analysis tools and strategies. Traders need to be proficient in the accurate plotting and interpretation of Fibonacci retracement and extension levels and understand how these tools reflect potential support and resistance in the market.
At the same time, successful application of this methodology also requires traders to be able to effectively combine the Fibonacci tools with other technical indicators such as moving averages, RSI, and MACD. This not only requires traders to have a solid foundation in technical analysis but also need to accumulate experience in the actual operation in order to improve the sensitivity of the market signals and the ability to judge.
In addition, the selection of Fibonacci retracement and extension levels may be somewhat subjective, which is mainly reflected in the identification of market highs and lows by different traders. Due to the volatility and complexity of the market, different traders may choose different key points for Fibonacci level plotting based on their personal observations and analytical methods.
This subjectivity may lead to differences in the retracement and extension levels plotted by each for the same market situation, thus affecting the final analysis results and trading decisions. Therefore, while the Fibonacci tool is very useful in technical analysis, traders should combine it with other analytical tools to improve the accuracy of their judgment and reduce the impact of subjectivity.
And in highly volatile market environments, DiNapoli points may become ineffective, as the high volatility and uncertainty of the market may cause pre-set support and resistance levels to lose their validity. Due to DiNapoli method relies heavily on historical data for analysis, this can lead to signal delays in rapidly changing market conditions.
Market dynamics tend to change rapidly and unpredictably, and historical data may not reflect current market conditions in a timely manner. As a result, trading signals based on historical data may lag when markets experience sharp fluctuations or unexpected events, which can affect the timeliness and accuracy of trading decisions.
The DiNapoli trading method is a systematic approach to technical analysis that provides an effective tool for market analysis by combining Fibonacci retracement and extension levels with other technical indicators. While this method has its advantages, such as clear support and resistance levels and multiple confirmation signals, it also has some disadvantages, such as requiring a high degree of experience and subjectivity. Proper use and combination of other technical analysis methods can enhance the accuracy of trading decisions.
 The DiNapoli Trading Method's Gold Rate Trading Approach
The DiNapoli Trading Method is broadly based on advanced Fibonacci techniques combined with leading indicators that enable it to identify high-probability trading opportunities and help traders enter the market at the best possible time. At the heart of the method lies the use of Fibonacci retracement levels (e.g., 38.2%, 50%, 61.8%) to identify potential support and resistance levels in the market and Fibonacci extensions (e.g., 61.8%, 100%, 161.8%) to predict target levels after price breakouts. This combined strategy of applying Fibonacci tools is effective in grasping market movements and making precise trading decisions.
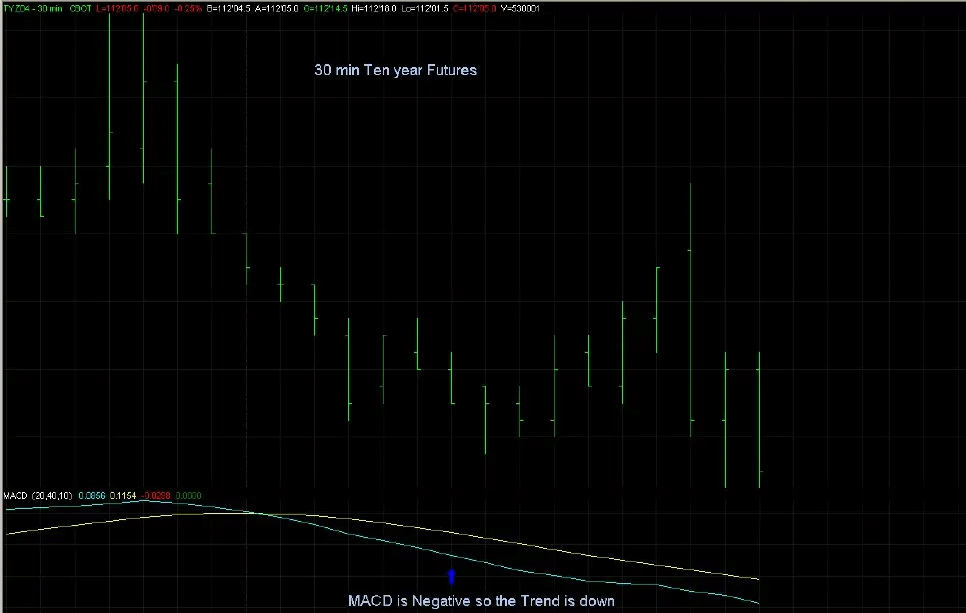
When applying the DiNapoli trading method, it is first necessary to use advanced techniques to accurately analyze market movements. Traders use lagging indicators such as displaced moving averages, smoothed moving averages of dissimilarity (MACD), and stochastics to determine the overall direction of the market, i.e., to identify whether the market is in an upward or downward trend. These lagging indicators provide information about the overall trend of the market and help traders develop an initial trading strategy.
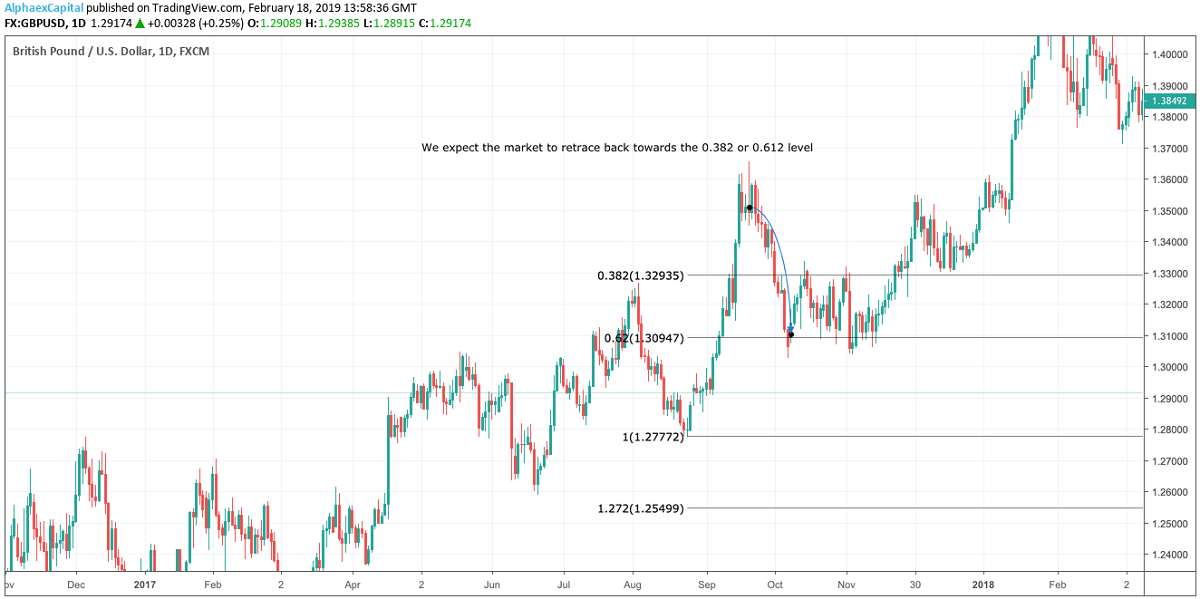
The trader then applies the Golden Ratio (An advanced Fibonacci analysis method) of the DiNapoli Trading Method to identify areas of support and resistance in the market in order to select the most accurate entry points. For example, as shown in the chart above, according to the Golden Rate trading method, the market is expected to be trending downward, with the 0.382 and 0.612 levels being the key resistance levels.
During the course of a trade, depending on the market trend, the DiNapoli trading method uses a variety of specific strategies to place orders to ensure that losses are minimized in the event that the market fails to maintain the expected price levels. In markets that are trending upwards, traders will often place stops below the actual support price. This practice is designed to prevent potential losses in the event of a price decline. By placing stops below support levels, it is possible to respond effectively to market fluctuations and minimize the risk of a price retracement.
Conversely, in a market that is trending downward, stops are placed above the actual resistance level. This is in response to upward price pressure and to protect traders from losses associated with price breakouts above resistance levels. With this flexible strategy of adjusting stops, traders are able to effectively control their risk in response to changes in market trends, thereby optimizing trading results and enhancing trading success in different market conditions.
Once the entry price and stop loss are determined, the next step is to calculate the Logical Take Profit Target, which is a leading indicator of the expected profitability of the trade. Once the logical profit target has been calculated, an order should be placed in the market immediately to ensure that the profit is locked in before the price reaches the desired target. Avoiding placing an order after the market has already hit the target point ensures that the best trading opportunities are captured and the expected profit is realized.
If the stop-loss point exceeds the risk management criteria, then it is simple to abandon the trade. The ability to specify the location of the stop loss point before the trade is made relatively easy to calculate. This ability to plan ahead helps to avoid trades that are outside of your risk tolerance and ensures disciplined money management.
When using directional graphical patterns to determine the direction of the market, directional indicators usually take precedence over trend indicators. This is because directional graphical patterns more accurately reflect general market trends and potential reversal points.
Overbought and oversold analyses, on the other hand, provide critical supporting information when entering and exiting markets, helping to determine more appropriate trade timing. By combining these two types of analysis, the effectiveness of a trading strategy can be optimized by more precisely selecting entry and exit points when market direction is clear.
In a nutshell, the DiNapoli method of trading the gold rate is to take a position in an uptrending market when the price pulls back and reaches a support level, and then take an arbitrage when the price rises to a pre-determined profit target. Correctly using high-quality leading indicators for this type of trading can provide significant benefits and potentially achieve a higher percentage of profitable trades.
Additionally, this method allows you to take advantage of the lowest trading spreads to place an order. When the market is close to the entry point, it can be bought at a lower price and sold at a higher price when the market rises. If the trade size reaches a certain point, this method can make a significant difference in profitability compared to using a traditional buy-stop or sell-stop strategy.
The Gold Rate trading method of the DiNapoli Trading Method is applicable to both long and short-term trades, demonstrating great flexibility. It can be used to advantage whether you are looking to capitalize on long-term trends or capture short-term volatility. Especially in highly liquid and heavily traded markets, such as stock index futures and forex markets, this method helps traders achieve solid returns through accurate support and resistance analysis and scientific stop-loss strategies.
DiNapoli trading method and its flexible application
| Description |
Application Markets |
| Merges Fibonacci and MACD indicators. |
Forex, Stocks, Futures |
| Fibonacci Retracement, Gold Rate, MACD |
Suitable for different time frames |
| Highly accurate entries, exits, and trend identification. |
Highly volatile markets |
| Provides clear trading signals and high flexibility. |
Short- and medium- to long-term trading |
| Requires advanced trading and technical analysis skills. |
Risk management in high volatility markets |
Disclaimer: This material is for general information purposes only and is not intended as (and should not be considered to be) financial, investment, or other advice on which reliance should be placed. No opinion given in the material constitutes a recommendation by EBC or the author that any particular investment, security, transaction, or investment strategy is suitable for any specific person.


 The DiNapoli Trading Method's Gold Rate Trading Approach


