The Awesome Oscillator (AO) is a technical momentum indicator, also known as the awesome oscillator indicator, developed by Bill Williams to assess market momentum and identify potential trend reversals. It is a boundless indicator centred around a zero line and is represented as a histogram of the difference between two simple moving averages (SMAs). The AO is widely used across various financial markets, including forex, stocks, and commodities, to confirm or challenge prevailing market trends.
How the Awesome Oscillator Works to Measure Market Momentum
The Awesome Oscillator formula is calculated by subtracting a 34-period simple moving average (SMA) from a 5-period SMA of the median price. The median price provides a more balanced reflection of market movements compared to using only opening or closing prices. The indicator oscillates between positive and negative values, with a positive value suggesting a bullish trend, whereas a negative value indicates bearish market sentiment.
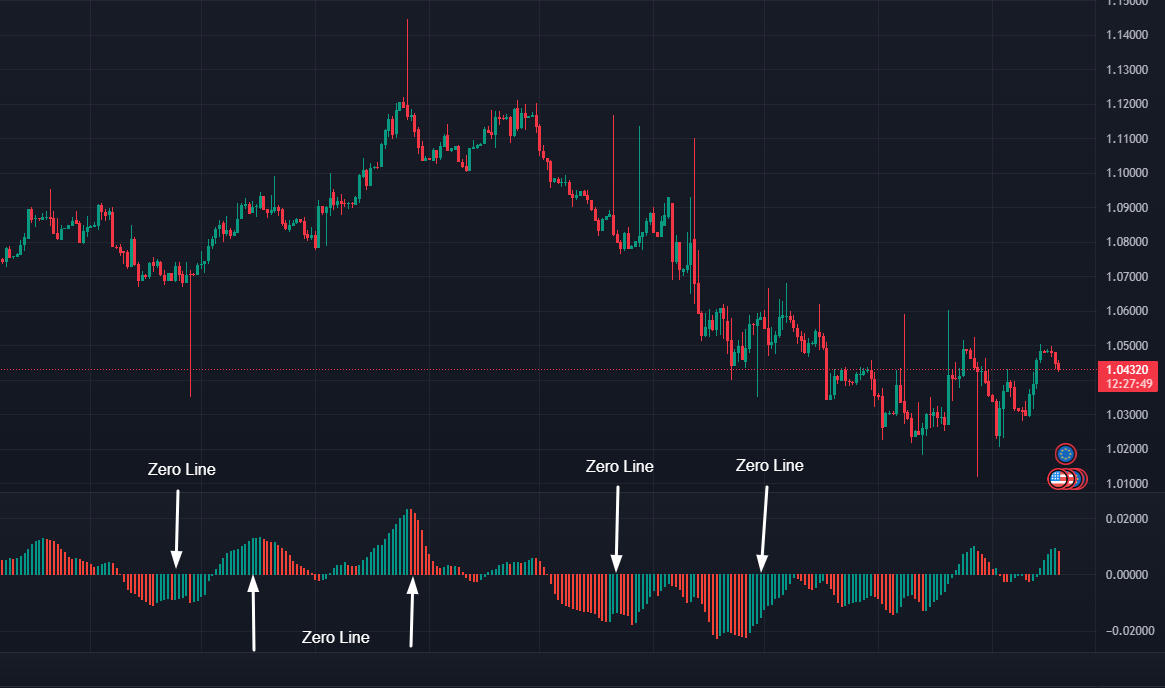
Zero Line Crossover

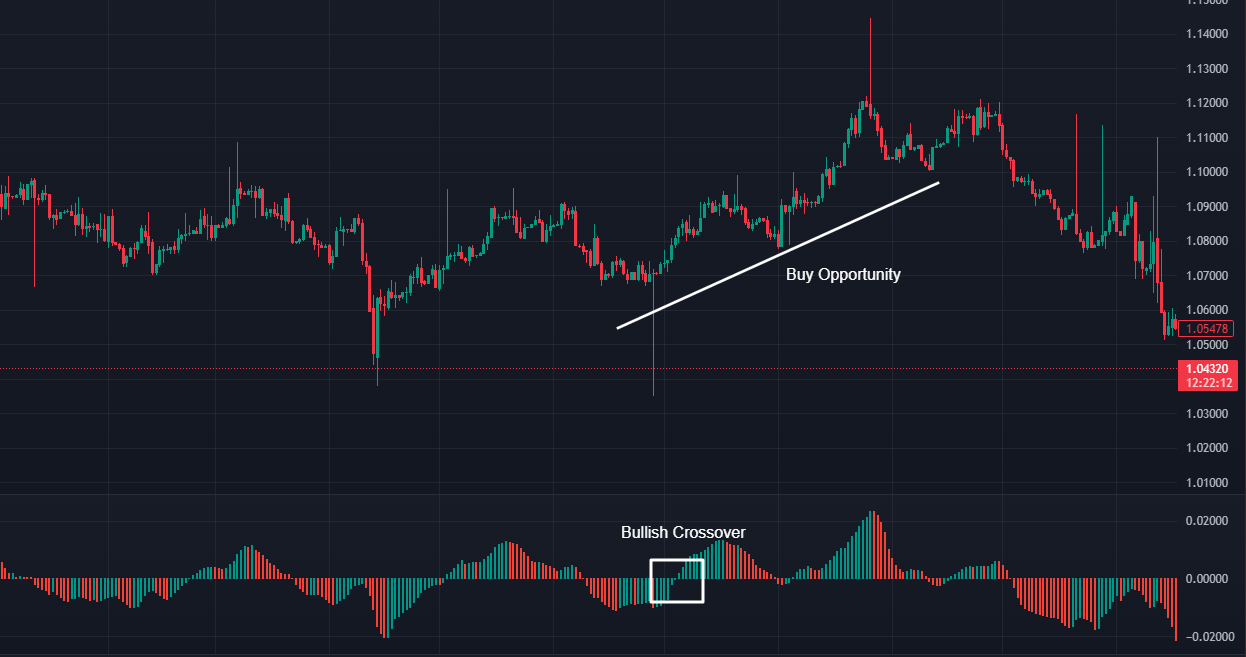
The zero-line crossover is a fundamental concept in using the Awesome Oscillator (AO) to generate Trading signals. This technique involves observing when the AO crosses the zero line, which is the point of equilibrium between bullish and bearish market momentum. A bullish crossover occurs when the AO moves from negative to positive values, indicating that short-term momentum is gaining strength and suggesting a potential buying opportunity. Conversely, a bearish crossover occurs when the AO shifts from positive to negative values, signalling that short-term momentum is weakening and suggesting a potential selling opportunity.
Traders often use the zero-line crossover in conjunction with other technical indicators to confirm the strength of the signal. For instance, combining the AO with the Moving Average Convergence Divergence (MACD) or the Accelerator Oscillator can provide additional confirmation of trend direction and strength. By leveraging the zero-line crossover, traders can effectively identify shifts in market momentum and make more informed trading decisions.
What is the Awesome Oscillator Formula?
Most trading software can display the awesome oscillator at the click of a button, but it's useful to know how the indicator is derived. Below is the formula for the AO:
One period = five periods SMA – 34 period SMA
Again, the SMA is calculated by adding together the median price of each day and dividing the total by the number of days in the period. Any period can be used when calculating the awesome oscillator, but most traders use a daily simple moving average of 34 days and five days.
It is important to note the indicator uses the midpoint value rather than the day's closing price, which can better track volatility.
Trading Strategies with the Awesome Oscillator: Scalping Strategy

Traders use the AO to generate various signals that help in decision-making. One common method is the zero-line crossover, where a bullish signal emerges when the AO crosses above the zero line, while a bearish signal appears when it moves below. Another effective approach is the saucer setup, which identifies buying or selling opportunities based on shifts in histogram direction.
The twin peaks formation can also indicate potential trend reversals when two peaks form above or below the zero line.
Another popular method is the awesome oscillator scalping strategy, which allows traders to capitalise on small and rapid price movements within volatile markets. This strategy emphasises using the Awesome Oscillator in conjunction with other indicators, like Bollinger Bands, to facilitate quick entries and exits during trades. By focusing on short timeframes, traders can optimise profits in fast-moving market conditions.
Advanced Trading Techniques
The AO becomes even more effective when used alongside other technical indicators. Both the Awesome Oscillator and MACD utilise moving averages to gauge market momentum, and using them together can enhance trading strategies by providing quicker signals and confirmation. Detecting divergence between the AO and price trends can signal possible reversals. Some traders also employ a scalping strategy, using the AO to pinpoint short-term price movements. Additionally, the AO can be used to confirm breakouts when combined with support and resistance levels, further strengthening the reliability of trading decisions.
Combining the Awesome Oscillator with Other Indicators
To enhance accuracy, traders often pair the AO with complementary indicators. The AO can be used to identify opportunities in a bullish or bearish market, allowing traders to capitalize on rapid price movements. The Moving Average Convergence Divergence (MACD) is a popular choice, as it helps confirm AO signals by analysing trend strength and direction. The Accelerator Oscillator (AC) works well alongside the AO by identifying early momentum shifts, providing a broader market outlook. Bollinger Bands are another valuable tool when used in conjunction with the AO, as they highlight market volatility and potential trading opportunities.
Customising the Awesome Oscillator
Although the AO's parameters, set at a 5-period and 34-period SMA, remain fixed, traders can customise its appearance for improved clarity. Adjusting histogram colours can help differentiate between bullish and bearish trends, making analysis more intuitive. Customising the histogram colours can help identify "consecutive green bars" as bullish signals, where two or more green bars above the zero line suggest a buying opportunity. Additionally, traders can apply the AO across different time frames, from short-term Intraday Trading to long-term market assessments, depending on their strategy and risk tolerance.
Common Mistakes and Pitfalls

While the AO is a powerful tool, traders should be mindful of common pitfalls. Considering the true market price, particularly the midpoint price, is crucial in making informed trading decisions. Using the AO in isolation without confirmation from other indicators can lead to unreliable signals. Market context is equally important, as misinterpreting signals without considering overall trend direction may result in poor trading decisions. False signals are another concern, particularly in ranging markets, making it crucial to refine strategies and remain adaptable to market conditions.
Awesome Oscillator and Market Momentum
Understanding market momentum is crucial for making informed trading decisions, and the Awesome Oscillator (AO) is a powerful tool for measuring this momentum. Market momentum refers to the rate at which a security's price or volume changes and the AO helps traders gauge the strength and direction of these changes.
The Awesome Oscillator measures market momentum by calculating the difference between two simple moving averages (SMAs): a 5-period SMA and a 34-period SMA, both based on the median price. The 5-period SMA captures short-term momentum, while the 34-period SMA reflects long-term momentum. By comparing these two SMAs, the AO provides a clear picture of the market's momentum.
When the AO is above the zero line, it indicates that short-term momentum is stronger than long-term momentum, signalling a bullish market. Conversely, when the AO is below the zero line, it suggests that short-term momentum is weaker than long-term momentum, indicating a bearish market. This ability to measure market momentum makes the AO an invaluable tool for traders.
Traders can also use the AO to identify potential trading opportunities by looking for divergences between the oscillator and the price chart. For example, if the price is making new highs but the AO is not, it may signal a bearish divergence, suggesting a potential reversal. By leveraging the Awesome Oscillator, traders can gain deeper insights into market trends and make more informed trading decisions.
Tips for Using the Awesome Oscillator
To maximize the effectiveness of the Awesome Oscillator (AO) in your trading strategy, consider the following tips:
-
Use the Awesome Oscillator in conjunction with other technical indicators: While the AO is a powerful tool, it works best when combined with other indicators to confirm trading signals. This multi-faceted approach can enhance the reliability of your analysis.
-
Look for divergences: Divergences between the AO and the price chart can be strong indicators of potential market reversals. For example, if the price is rising but the AO is falling, it may signal a bearish divergence, suggesting a possible downturn.
-
Use the zero line crossover: The zero line crossover is a straightforward yet effective method for identifying trading opportunities. A bullish signal occurs when the AO crosses above the zero line, while a bearish signal appears when it crosses below.
-
Monitor the Awesome Oscillator's histogram: The histogram provides valuable insights into market momentum. Pay attention to the colour and height of the bars, as they can indicate shifts in market sentiment.
-
Adjust the time frame: The AO can be applied across various time frames, from short-term intraday trading to long-term market analysis. Adjust the time frame to align with your trading strategy and risk tolerance.
-
Use the Awesome Oscillator to confirm trends: The AO can help confirm existing trends and identify potential trading opportunities. For instance, if the AO is consistently above the zero line during an uptrend, it reinforces the bullish market sentiment.
-
Don't rely solely on the Awesome Oscillator: While the AO is a valuable tool, it should not be used in isolation. Combine it with other technical indicators and fundamental analysis to make well-rounded trading decisions.
By following these tips, traders can effectively use the Awesome Oscillator to enhance their trading performance and make more informed decisions.
Conclusion
The Awesome Oscillator is a valuable tool for analysing market momentum and identifying potential reversals. By integrating it with other technical indicators and refining trading strategies, traders can significantly enhance their decision-making processes. Continuous learning and backtesting different AO applications will help traders optimise their performance and stay ahead in dynamic market conditions.
Disclaimer: This material is for general information purposes only and is not intended as (and should not be considered to be) financial, investment or other advice on which reliance should be placed. No opinion given in the material constitutes a recommendation by EBC or the author that any particular investment, security, transaction or investment strategy is suitable for any specific person.


