ADX Index (Average DirectionIndex, also known as the average trend index, is a technical indicator that belongs to trend judgment. The ADX index cannot determine the direction of market development, but it can determine the strength of market trends. That is to say, it can determine the likelihood of the market following the current trend, used to determine whether the future market will continue the trend or reverse.
Detailed explanation of ADX indicators
1. Indicator composition.
ADX indicators, including+DI and+DIComposed of an ADX Trend Line, the calculation of ADX indicators is relatively complex. Firstly, it is necessary to determine the directional movement indicators; Secondly, calculate the average directional movement indicator ADM; Once again, calculate even the amplitude indicator TR; Fourthly, calculate the average amplitude indicator ART; Fifth, calculate the directional indicator DI; Sixth, calculate the directional motion index DX; Finally, the ADX value can be obtained.
2. Numerical analysis.
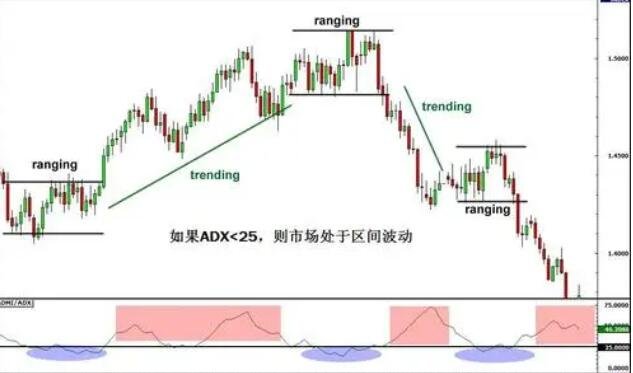
In determining the strength of a trend, the ADX value usually takes 20 as the median value, which is considered as the absence of a trend in the sideways market. When ADX is greater than 30, it indicates that the trend intensity is relatively high and the market will still develop along the current trend; When ADX is less than 10, it often indicates a weak trend in price trends, and it is necessary to be cautious of a reversal in the market. At the same time, the relationship between ADX and DI can also be used to predict market trends. Generally speaking, when - DI breaks through+DI upwards, it is considered a golden cross and a buying opportunity. When+DI breaks through - DI downwards, it is considered a dead cross and a selling opportunity.
3. Practical application.
When analyzing the actual market trend, ADX is usually regarded as a reference value, because in most cases, during market fluctuations, ADX numerical indicators cannot reflect market conditions; At the same time, this indicator is based on market forecasts from past data, and it is also difficult to fully and accurately reflect the market composite index. Therefore, in general, the adx indicator is used as an auxiliary reference value in market analysis.
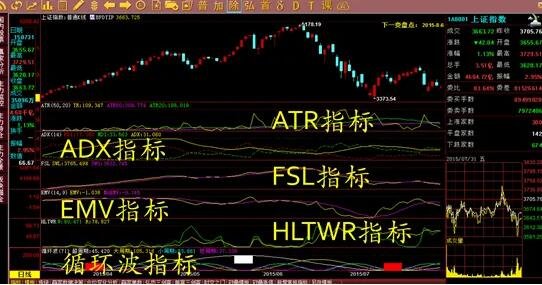
A profitable trading trend. These values are also important for distinguishing between trend and non trend conditions. Many traders use ADX readings above 25 to indicate that the trend is strong enough. On the contrary, when ADX is below 25, many people tend to avoid trend trading strategies.
The direction of the ADX line is crucial for interpreting trend intensity. When ADX rises online, the strength of the trend increases and prices move in the direction of the trend. When the trend decreases offline, the strength of the trend weakens and prices enter a period of retreat or consolidation.
Calculation stEPS for Average Trend Index (ADX):
ADX measures the gap between+DI13 and - DI13 (up trend+DM, down trend - DM).
The calculation process is divided into two steps:
1. Calculate daily trend indicator DX:
DX=[(DI13) - (- DI13)]/[(DI13) (- DI13)] * 100
For example,+DI13=34- If DI13=18, then DX=(34-18)/(34+18) * 100=16/52 * 100=30.77, rounded to the nearest 31.
2. Taking the Moving Average of DX (such as 13 day EMA), it is the "average trend indicator" ADX. When the trend is sound, the gap between+DI13 and - DI13 and ADX will increase; When the trend reverses or the market enters a horizontal range, ADX will decline, and trading with the trend should take the upward phase of ADX instead of the downward phase of ADX.
Trend change value refers to the maximum part of today's range that exceeds the previous day's range.
A. If today's range goes up beyond the previous day's range, it is considered a positive trend change (DM).
B. If today's range goes down beyond the previous day's range, it is considered a negative trend change (- DM).
C. If today's interval is within the previous day's interval, or if today's interval goes up and down and goes out of the previous day's intervalThe distance between the day intervals is equal, which is considered as no trend change (DM=0). If the distance between today's interval and the previous day's interval is not equal, it may be a positive or negative trend change, depending on the comparison of another exceeding part.
D. If there is a limit up today,+DM represents the distance between today's closing price and the previous day's highest price. If there is a down limit today, - DM represents the distance between today's closing price and the previous day's lowest price. The behavior trend system of the masses measures the ability of long and short sellers to push prices out of the previous day's trading range, thereby judging the changes in long/short forces. If today's high price is greater than the previous day's high price, it indicates a strengthening of the bullish views of the market public.
If today's low price is lower than the previous day's low price, it indicates that the bearish sentiment of the market has strengthened. The relative positions of the two trend lines (+DI13 and - DI13) can display trends. When the positive trend line is higher than negativeTrend line, indicating that bulls dominate the market. When the negative trend line is higher than the positive trend line, it indicates that the bearish force is relatively strong, and trading should follow the direction of the upward trend line.
When the distance between the two trend lines widens, the average trend indicator ADX will rise, indicating that the dominant group in the market has become stronger, and the disadvantaged party is even weaker. The existing trend should continue to develop. When ADX rises, trading should be carried out using a downstream method based on the direction of the upward trend line. When the distance between two trend lines becomes closer, the average trend indicator ADX will decrease, indicating that the dominant group in the market is weakening, and the disadvantaged party is turning the situation around. The market is entering a chaotic stage, and it is best not to use the method of trading with the trend.
【 EBC Platform Risk Reminder and Disclaimer 】: There are risks in the market, and investment needs to be cautious. This article does not constitute investment advice.


