Moving Average, also known as MA, is one of the most commonly used and effective technical indicators in the stock market. With a profound historical background and extensive market applications, it remains an enduring classic indicator.
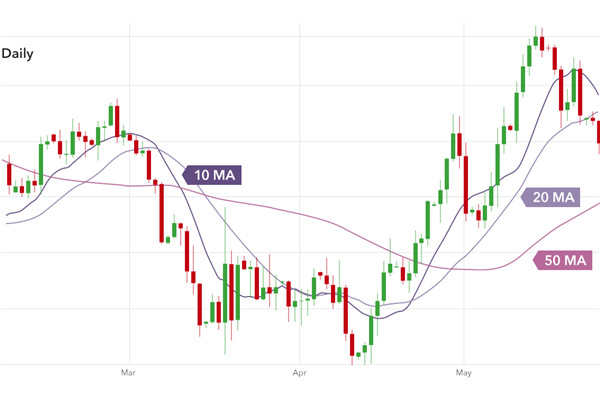
MA is a technical indicator that uses statistical analysis to average securities prices (indices) over a certain period of time and connect the average values at different times to form a MA, which is used to observe the trend of securities price changes.

The Historical Origin of MA
The moving average MA was created by renowned American investment expert JosephE. Granville was proposed in the mid-20th century and was widely sought after by the market. It quickly became the most widely used technical indicator in the world today. It helps investors discover stock operating trends and is the most typical trend based technical indicator.
Calculation Method of MA
N-day moving average=sum of N-day closing prices/N
(Note: The calculation method for MA is very simple, which is the N-day average of the closing price. However, although the calculation method is simple, the connotation of the indicator is profound and effective.)
Indicator Properties of MA
1. Trendliness
One of the three major assumptions of technical analysis is that Stock Prices fluctuate according to trends. It is precisely because of the trend that technical analysis comes into being, and the MA indicator is classic because it can largely reflect the trend of stock prices, grasp the buying and selling direction through trends, and obtain profits.
2. Stability
Stability is an important property of MA, and in most cases, it is extremely stable. It will not change the original trend direction due to occasional fluctuations in stock prices. Only when the stock price continues to rise or fall, the direction of MA may change.
3. Hysteresis
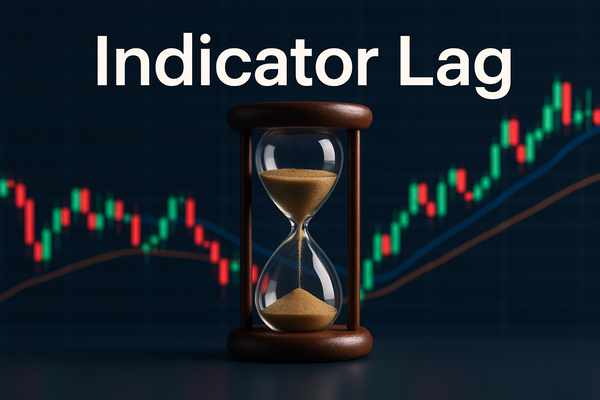
It is precisely because MA is extremely stable that it has brought some negative effects, which is hysteresis. It always waits until the stock price drops significantly to show that the trend of the stock price has changed, and it always waits until the stock price rises significantly to show that the opportunity has arrived. Latency makes the moving average analyst unable to eat fish's head and fish's tail, and can only eat fish's body. However, even if it's just a fish body, the profits are already quite substantial.
【 EBC Platform Risk Reminder and Disclaimer 】: There are risks in the market, and investment needs to be cautious. This article does not constitute investment advice.


