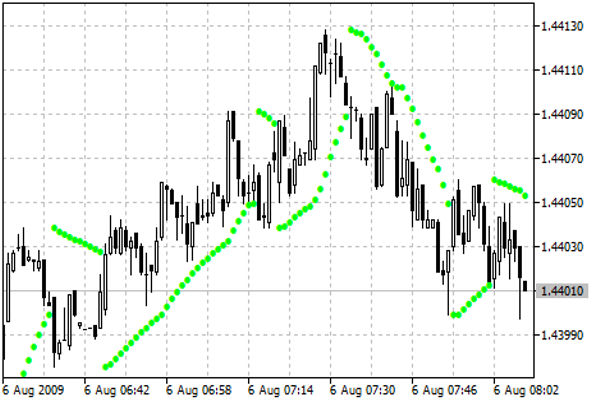
The Moving Average is one of the most commonly used and relatively accurate indicators in technical indicators. It is based on Dow Jones theory and digitized to predict the short-term, medium-term, and long-term changes in Stock Prices from the changes in numbers. The moving average (MA) is the line connecting the arithmetic mean of the market price (usually the closing price) for several consecutive days. The number of days sampled is the parameter of MA. You can calculate the moving average of a stock price index over a certain period, or the moving average of a certain stock price over a certain period, and then draw a moving average line based on the calculated moving average.
Four Key Characteristic of Moving Average (MA)
1. Trendliness. Being able to represent the fluctuation trend of stock prices and following this trend will not easily change.
2. Hysteresis and stability. When the original trend of stock prices undergoes a reversal, MA's response is slower and the speed of the turnaround lags behind the overall trend. These two aspects of the same problem complement each other.
3. Helping up and helping down. When the stock price breaks through MA, whether it is an upward breakthrough or a downward breakthrough, the stock price has a desire to continue to move in the direction of breakthrough inertia. This is caused by the support and pressure of MA, and breaking the moving average means breaking through the support or pressure line, indicating that the market has accumulated a certain amount of energy, which is reflected in the trend of inertia.
4. Market average cost-effectiveness. MA is the average cost, and the MA on day X represents the market average cost within day X. When MA is upward, it indicates that the cost of buyers has been continuously increasing in the recent period; When MA goes down, it indicates that the selling price has been continuously decreasing in the recent period.
The moving average can be divided into three types: short-term, medium-term, and long-term. Generally speaking, short-term MA is recommended for short-term investors, medium-term MA is recommended for mid line investors, and long-term MA is recommended for those who have bought stocks for a few years.
The short-term MA is mainly the 5-day and 10-day moving averages. The domestic stock market has 5 trading days per week, so MA5, also known as the weekly line, is the strongest support or resistance in the short term. In bull markets, a correction in stock prices near MA5 is a better buying opportunity; In short markets, MA5 is often a strong resistance level for weak rebounds.
As the most widely used moving average, MA10 can accurately reflect the changes and trends in the average cost of stock prices in the short term, and is a strong short-term support and resistance. Generally speaking, bullish markets or strong stocks will not fall below the MA10 during a pullback, and even if they fall below, it is instantaneous; It is difficult to cross the MA10 in short markets or when weak stocks rebound.
The mid-term MA is mainly based on the 20 day, 30 day, and 60 day moving averages. The monthly line is generally sampled as the actual trading month, which is the 20th day. This line indicates the average holding cost of the stock price for a month, and can pre display the future direction of stock price changes before the stock market is very clear. MA30 is based on natural months. The seasonal line is generally sampled for 60 days, and its fluctuation amplitude is smoother and has trajectories to track compared to short-term MA, while long-term MA has high sensitivity.
The long-term MA is mainly based on the 120 day and 250 day moving averages. The half year line is usually sampled for 120 days, and domestic listed companies release their financial statements four times a year. Therefore, the average cost of the market for half a year often becomes the focus of attention for both long and short sides.
Long and Short Positions
A bull market is a typical bull market where the daily, weekly, or monthly K-line is above the moving average, followed by short-term MA, medium-term MA, and long-term MA. This indicates a strong demonstration effect of profit making in the market, with short-term, medium-term, and long-term K-lines earning profits.
 in foreign exchange transactions?")
Multiple Arrangement
Short selling arrangement refers to the daily K-line being below the moving average, followed by short-term MA, medium-term MA, and long-term MA, indicating a strong loss effect in the market. Selling short, medium, and long-term lines at this time is a typical bear market characteristic.
 in foreign exchange transactions?")
Short Order
The intersection of gold and death.
The golden cross refers to the upward crossing of the short-term moving average, the mid-term moving average, or the long-term moving average, or the upward crossing of the mid-term moving average, also known as the golden cross, indicating that stock prices will continue to rise.
KDJ
The dead cross refers to the downward crossing of the short-term moving average, the mid-term moving average, or the long-term moving average, or the downward crossing of the mid-term moving average, also known as the dead cross, indicating that the stock price will continue to decline.
 in foreign exchange transactions?")
Dead Fork
Common Opportunities for Warehouse Building in Practical Combat
At position 1, after a continuous decline in the average line, it began to flatten out and showed signs of rising. The stock price also turned up and broke the average line from below, which was the first signal to build a position. From the figure below, it can be seen that the average line has stopped falling and turned flat, indicating that the stock price will turn into an upward trend. At this point, the stock price will break through the average line and rise again, indicating that the stock price has broken through the bearish pressure on the day, and multiple parties have been in a relative advantage position.
 in foreign exchange transactions?")
Position building point 2: The stock price is above the moving average and suddenly shows a sharp downward trend. After falling below the average, it suddenly turns its head upwards and breaks through the moving average from below, which is the second signal for position building. (This is the old duck head trend)
Because the moving average is relatively slow, when the average continues to rise, if the stock price drops sharply and falls below the average, in most cases this decline is just an illusion, and after a few days, the stock price will rebound above the average, so it is also a buying opportunity.
 in foreign exchange transactions?")
 in foreign exchange transactions?")
Position building point 3, where both the stock price and the average line are declining, but when the stock price drops significantly below the average line, it moves away from the average line, indicating that a rebound is imminent. This third position building signal is loved by many short-term customers, and this method is not recommended. Short term operations are relatively large, and personal technical requirements are relatively high. This kind of rebound should not be too aggressive, because the overall situation itself is not good, and long-term battles are bound to be trapped.
 in foreign exchange transactions?")
Common Selling Opportunities in Practical Situations
Selling 1, the average line has shifted from rising to flat, and there is a downward trend, while the stock price has also dropped above it, falling below the average line, which is the first selling signal.
Selling 2, both the stock price and the moving average were disappointing and sliding downward. At this point, the stock price rose from below and broke the still falling average before turning around and falling to break the average, indicating that the stock price trend is declining. This is the second selling signal.
Selling 3, the average line shows an upward trend, and the stock price has skyrocketed, far exceeding the average line that is also rising. This often indicates that the stock price is not far from the peak, and there will be a sharp drop after the surge, which is the third selling signal.
【 EBC Platform Risk Reminder and Disclaimer 】: There are risks in the market, and investment needs to be cautious. This article does not constitute investment advice.