Published on: 2023-06-05
Updated on: 2024-05-29
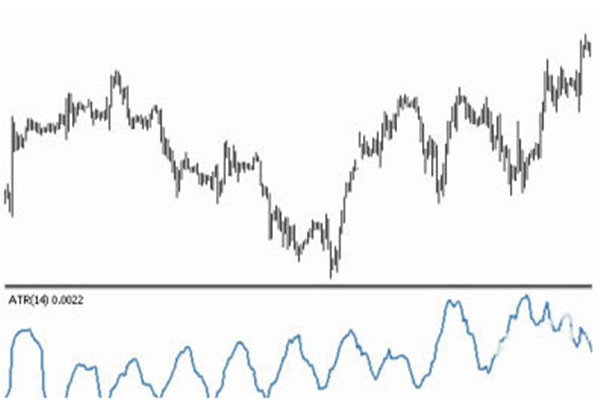
The ATR indicator is a volatility indicator, also known as the average amplitude indicator. It calculates the difference between a series of high and low points during a previous period, and this value is generally reflected in decimal form. ATR value and volatility change in the same direction, which makes it convenient for traders to measure the price fluctuations in the Securities market.
ATR, also known as the Average true range, or ATR indicator, is a measure of the average true range of fluctuations, developed by J. Welles WilderInvented, the ATR indicator is mainly used to measure the intensity of market volatility, which is an indicator to display the rate of market change.
Firstly, this indicator is mainly used to measure price fluctuations. Therefore, this technical indicator cannot directly reflect the price trend and its stability, but only indicates the degree of price fluctuations.
This indicator is very typical for periods of long-term sustained edge movement, which usually occurs at the top of the market or during price consolidation periods. The principle of predicting based on this indicator can be expressed as follows: the higher the value of the indicator, the higher the likelihood of a trend change; The lower the value of this indicator, the weaker the mobility of the trend.

The calculation method for the average true wave amplitude of ATR:
1. The fluctuation between the highest and lowest prices on the current trading day
2. The fluctuation between the closing price of the previous trading day and the highest price of the current trading day
3. The fluctuation between the closing price of the previous trading day and the lowest price of the current trading day
The maximum value of today's amplitude, the difference between today's highest and yesterday's closing price, and the difference between today's lowest and yesterday's closing price is the true amplitude.
After obtaining the true amplitude, ATR can be calculated using the average value over a period of time. As for how long it takes to calculate, different users have different habits, ranging from 10 days, 20 days, and even 65 days.
Calculate the N-day Moving Average parameter of the true wave amplitude: N days, usually taken as 14. Calculation formula: TR:MAX (HIGH LOW), ABS (REF (CLOSE, 1) - HIGH), ABS (REF (CLOSE, 1) - LOW)); ATR:The real amplitude of MA (TR, N) ATR and the contraction of the fluctuation range background: Many technical experts have noticed that significant price movements often occur after a calm sideways consolidation of prices. By comparing short-term ATR and long-term ATR, it is very easy to identify horizontal consolidation ranges with calm prices. For example, when the 10 period ATR is less than or equal to 0.75 times the 50 period ATR, it indicates that the market has been unusually calm recently. This is a background condition, indicating that the critical entry time is right in front of us.
The ATR indicator does not indicate the direction of prices, only the intensity of price changes. In the early days, ATR indicators were mostly used in futures markets, but now they are also used in financial markets such as stocks and foreign exchange.
Extreme high or low ATR values can be seen as a reversal of price trends or the beginning of the next trend. As a technical indicator based on price volatility similar to the Bollinger channel, the mean of true volatility cannot directly predict price trends and their stability, but only indicates the frequency of trading activities. A lower ATR (i.e. smaller true volatility) indicates a relatively cold market trading atmosphere, while a higher ATR (i.e. smaller true volatility) indicates a more vigorous trading atmosphere. A prolonged period of low ATR is likely to indicate that the market is accumulating strength and gradually starting the next price trend (which may be a continuation of the previous trend or a reversal of the trend); A very high ATR is usually caused by a significant increase or decrease in prices in a short period of time, and it is usually not possible to maintain this value at a high level for the long term.
Traders can also use ATR to set their own stop loss and stop win prices. Since ATR calculates the true range of fluctuations in a currency pair over a certain period of time, this range can be used as the standard for calculating stop loss and stop win.
EBC Platform Risk Reminder and Disclaimer: There are risks in the market, and investment needs to be cautious. This article does not constitute investment advice.