What is ATR Indicators?
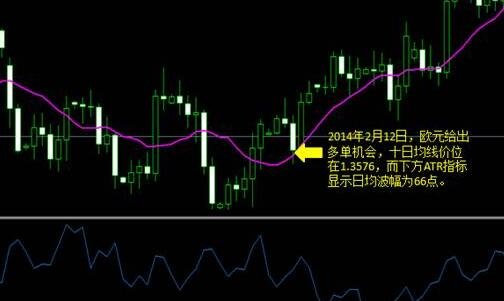
ATR is a volatility index, also known as the average index. It calculates the difference between a series of high and low points within a certain period of time, and the numerical value is generally expressed in decimal form. The direction of variation of the Atr value is the same as the volatility, which provides convenience for traders to measure the price fluctuations in the Securities market. How is the ATR indicator used in stocks?
How to use ATR indicators?
1. The atr index is used to set stop loss levels. Due to the fact that ATR is a measure of volatility, the higher the ATR value, the greater the likelihood that investors will be stopped by volatility during market fluctuations. Therefore, in this case, the distance between the stop loss and entry price should be set further.
2. The ATR index is used to select entry and exit points. Short term atr is generally greater than long-term atr. We can enter the market according to the corresponding price direction through the volatility difference between the short-term and long-term ATR curves, and close positions when the trend is relatively stable.
3. By matching funds with ATR values, it is evident that investment products with higher ATR values have greater price fluctuations and greater profit opportunities.

Analyzing Gold: A Case Study
First of all, let's talk about the usage of homeopathy trading in a day. If the recent ATR of gold is 300 points ($30), and gold has one day increased by about 100 points compared to the opening price, we predict that gold will close on the positive line of K on that day, and there is still around 200 points of upward space on that day. Therefore, if we decide to take advantage of the trend and go long, we can predict in advance where the high point of the day will be,Roughly based on location, current prices, and our target profit position for the day, we can only set it within the remaining 200 points of ATR, and cannot set it too far from reality.This is a reference for setting profit taking using the ATR index after selecting the entry point. This is the usage of homeopathy trading.
Let's talk about the use of counter trend callbacks. The European intraday trading time has entered noon, especially when the European afternoon overlaps with the New York morning, and it is already evening time in Asia. At this time, the foreign exchange market intraday trading has been running for about two-thirds of the time, and most days the intraday volatility is already around 1ATR. At this point, the probability of New Yorkers continuing to directly push the market after the market opens is very low, because if they continue to follow the trend, they will lift the sedan chair for the profit making sectors in Asia and Europe in the morning, and be suppressed by the large sales and positions of the profit making sectors, which can be described as hard work! Therefore, nine out of ten, New Yorkers may engage in a pullback or reversal, or start with a wave of pullbacks in the morning to wash out the Asian and European profit sectors, followed by a wave of favorable trends, or start with a short-term favorable trend to lure bullish or short positions, and then suddenly reverse, leading to a major reversal. Using ATR for callback operation means that when the amplitude reaches around 1ATR within the day, it will be synchronized with the entry of the American public, supporting the position entry callback in some key obstacles.
When using ATR for Bo callback, it is important to note that one cannot be too greedy for profits, and must be fast in and out! Because it is a correction in the market, it is often only around 0.382 Fibonacci. After several days of correction, the reversal expands, and the daily line K ultimately ends up with a bald head positive line or a bare foot negative line. So, if the reversal is not fast forward or fast out, it is too good, and it will be easy to be caught or swept to stop loss. Going against the trend carries risks. Going against the trend is to snatch food between the dealer's teeth, and pulling teeth from the tiger's mouth is a risky behavior. It's best not to play this action as a non super short line master! For example, on May 28th, at 9:00 am in the New York Gold MarketA 60 point callback accurately appears on the PP line of the position axis,10: A 77 point pullback accurately occurred at 1900, with a main resistance level at the double zero integer level. Super short-term masters can quickly move in and out at these two important resistance levels, lock in profits, and easily scrape profits from 10 to 30. If these two positions expect to earn a profit of 100 or 80 points when entering short selling, and remain patient with holding positions, then if the profit is too large, it will be difficult to achieve the goal, and ultimately the price will reverse again. Until the closing time, the daily K-line will close the bearish line, and those who make too much profit in the daily bullish pullback will be quilted or swept to stop loss.
【 EBC Platform Risk Reminder and Disclaimer 】: There are risks in the market, and investment needs to be cautious. This article does not constitute investment advice.


