The closing price refers to the price of the last transaction at the end of a
certain trading day in the stock market. In stock trading, there are important
price indicators such as the opening price, highest price, lowest price, and
closing price every day. The closing price is usually regarded as the overall
performance of the market on that day and is also an important reference for
investors to conduct technical analysis and formulate trading strategies.

The determination of the closing price is automatically calculated through
the trading system of the exchange, which represents the last trading price of
the market on that day. At the end of the trading day, the exchange will
announce the closing price of the day, which will be widely watched and quoted.
The high or low closing price can reflect the overall market trend and investor
sentiment on that day.
The importance of the closing price lies in its ability to provide a
reference for investors to determine the trend of stocks and the market. For
example, if the closing price of a stock continues to rise for several
consecutive days, it can be considered that the stock is in an upward trend, and
investors may consider buying. On the contrary, if the closing price of a stock
continues to decline for several consecutive days, it may indicate that the
stock is in a downward trend, and investors may consider selling or avoiding
buying.
In addition, the closing price can also be used to calculate the fluctuation
and yield of stocks. The rise and fall range refers to the difference between
the closing price of the day and the closing price of the previous trading day,
while the yield refers to the return obtained by investors holding stocks within
a certain period of time. These indicators can help investors evaluate their
investment performance and market volatility.
The significance of stock closing prices
The high or low closing price often reflects the degree of market funds'
attention to a particular stock and has the function of indicating the direction
of the next trading day. We mainly compare the closing price with the opening
price, highest price, and lowest price on the same trading day and judge the
trend characteristics of Stock Prices based on several different situations:
If the closing price is higher than the opening price, it indicates that the
stock has some resistance. Among them, if the stock opens low and rises high
during a decline, it indicates ultra-low capital intervention, but if it opens
high and rises high, it indicates that the stock is in a strong upward process.
If the closing price is lower than the opening price, it often means that the
stock has an adjustment requirement.
Generally speaking, the closing price has great guiding significance for
short-term investors, especially in the tail market. If the volume rises, the
stock price will close at a higher price on the same day, and the next day will
often have more outstanding performance, so such individual stocks have
short-term opportunities. But for medium- to long-term investors, paying
attention to the closing price is often the best way to judge changes in trend.
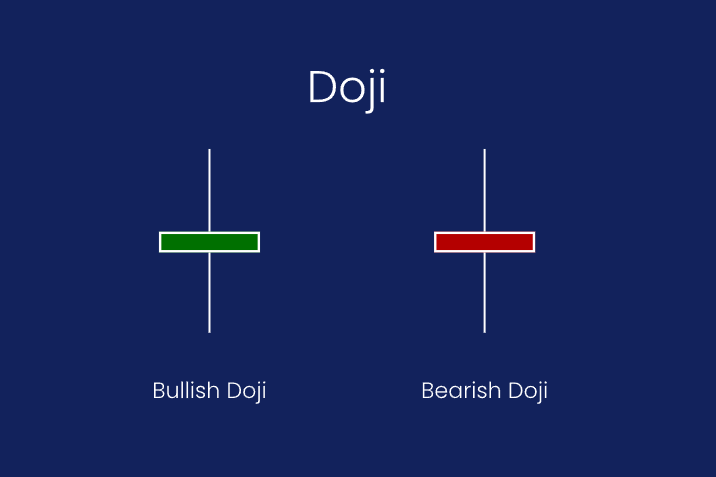
When a cross star with a long shadow appears, it generally indicates the arrival
of the bottom of an individual stock, which has positive technical significance
for market stock judgment. Conversely, it can be judged as the head of the
individual stock trend.
It should be noted that the closing price is only a price point in the
financial market and cannot fully represent the price fluctuations of the entire
trading day. During trading days, the prices of stocks and other financial
assets will constantly fluctuate, sometimes even with obvious highs and lows.
Therefore, in addition to the closing price, there are other price points and
indicators that also need to be considered and analyzed to comprehensively
understand the market dynamics.


