In the history of global trading, master traders are like bright stars lighting up the vast universe of stars.
Whether it's Livermore, the "big bear", William Gann, the "founder of technical analysis," or Graham, the "Buffett teacher" and "value investment master", they have left their own eternal mark in the long river of trading with their respective trading theories.
Richard Wickoff was also the most shining giant in the trading industry of that era.
Compared to simple price and value analysis, he firmly believes that successful trading needs to be based on understanding market rules, especially the impact of large funds on the market.
He summarized the rules of the market into four stages: "fundraising, rising, distribution, and falling", and combined them with the trading concepts of JPMorgan Chase and Livermore. Based on market analysis and market analysis, he formed a set of Wickoff trading methods that are still the norm among global investors.
So, how does the Wykov trading method deconstruct market trading rules through position analysis?
1. Determining the trading stage using the Wickov trading method
Richard Wickoff's life experience did not experience ups and downs like other trading masters, leaving behind a legendary and lamentable past.
Starting at the age of 15, I worked as a stock quotation officer, starting my own company in my twenties, and then establishing a stock market college in the 1930s to help investors identify key institutions for fundraising, washing, and distribution. A few words are enough to summarize his legendary life.
As the saying goes, peaches and plums remain silent, and their own way of life becomes unique. His theory combines universality and practicality, which allowed his students to relay and promote the Wickoff trading method since the 1930s, which has been passed down to this day and has been enduring.
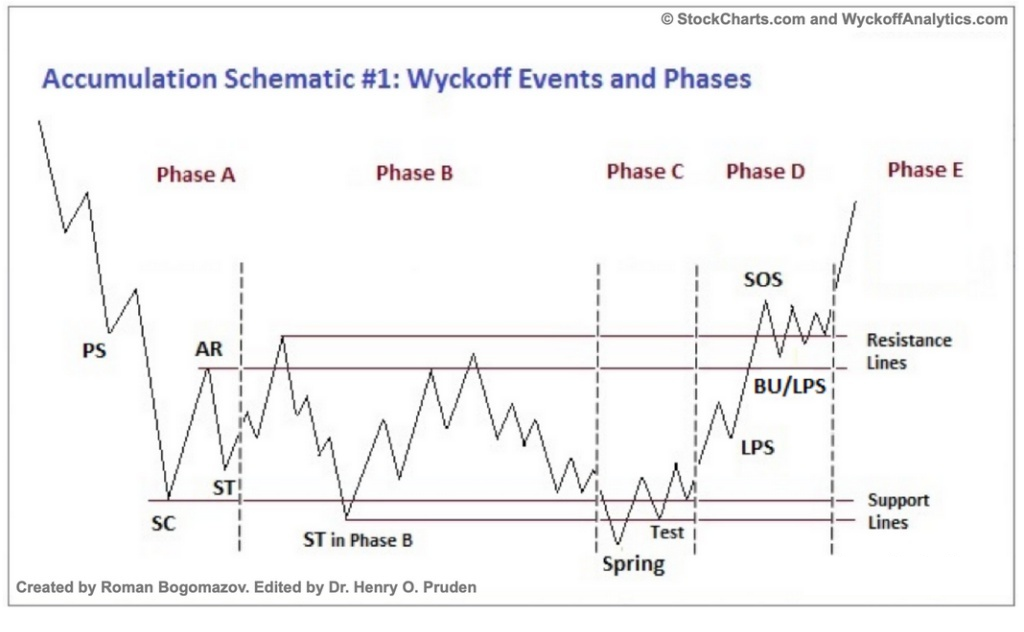
The core of the Weikov trading method is to predict the stages of the trading price cycle through supply and demand analysis, such as studying price behavior, trading volume, and time: fundraising, rising, distribution, and falling.
Fundraising stage
At this stage, institutional demand begins to increase, so buyers will gradually raise prices.
PS - Preliminary Support:
A large amount of buying provides significant support after a long-term decline. The increase in trading volume and the widening of price difference indicate that the downward trend may be nearing its end.
SC - Selling dense areas:
There will be a lot of panic selling. But the closing price is far away from the lowest price, and institutions are buying at the bottom.
AR - Automatic rebound:
Because the market selling pressure has greatly weakened. The high point of simultaneous rebound is usually also the top of the horizontal market.
ST - Second Test:
The price has once again fallen to the selling intensive area. If it is the bottom of the market, when the price approaches the selling intensive area, the trading volume and amplitude will significantly decrease.
Spring - Spring effect and vibration chamber:
In a market with sideways fluctuations, the main force will wash the market before the rally in order to pull up. Generally, prices will fall below the previous support level for a short period of time, but will recover above the support level at the close of the market. If the trading volume is not high when the price falls below the support zone, it indicates that it can rise.
SOS - Strong Signal:
Strong signal, with prices rising while volume increasing and amplitude increasing
LPS - Final Support Point:
Before confirming the rise, step back to confirm the support provided by the previous oscillation range, accompanied by a decrease in amplitude.
2. Rising stage
The buyer has absorbed enough chips and pushed the price up to the upper limit of the range, indicating a bullish trend on the chart.
3. Distribution stage
The distribution stage can be seen as the opposite of the fundraising stage. At this stage, the market is also accompanied by fluctuations in positions and trading volume, and even false breakouts. However, in the end, bears dominate and the market begins to decline unilaterally.
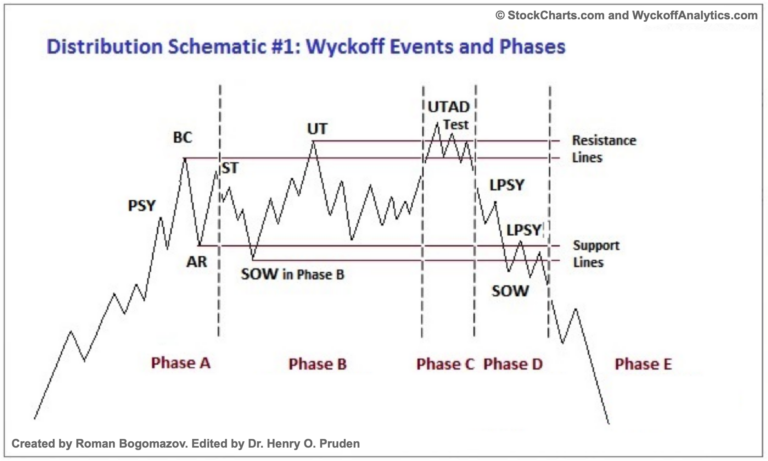
4. Falling stage
The seller has gained sufficient strength to push the market into a bearish trend.
2. Order flow tool, concretization of the Wykov trading method
With the increasing activity of global trading markets, trading frequency and volume have shown a geometric level of growth, and arguments about technical and news failures are constantly heard.
Against this backdrop, the Wykov trading method has further moved towards the front desk - based on volume price analysis, bypassing the frequent market fluctuations and using large fund behavior as the basis for judgment, making it easier to grasp the overall direction of the market.
For the foreign exchange market, due to the lack of a concept of trading volume, more institutions have also begun to turn to the analysis of main funds and developed order flow tools based on the Wickov law.
Currently, over 70% of Wall Street transactions are completed through order flow tools.
The order flow tool strictly follows the three principles of the Wykov trading method:
Principle of supply and demand
Causal principle
Principle of direct proportion between input and output (unification of quantity and price)
1. Principle of supply and demand
Taking the order flow tool of EBC Group as an example, it will display real-time trading data, display the supply and demand relationship of the market, and display it in the form of market depth maps (DOM), footprint maps, and cumulative difference maps.
Through the EBC order flow tool DOM Intraday Trading tool, we can see the complete commissioned order situation representing the entire market depth. Through the location of large orders, we can clearly grasp the price points hidden in limit orders with huge profits.
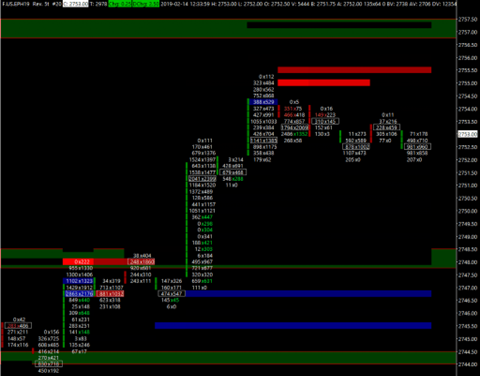
The footprint map is a combination of market depth map and K-line map, through which you can see the situation of buying and selling orders within a single K-line:
When there are much more buying orders than selling orders, it indicates that the price level is a potential support level;
When there are many more selling orders than buying orders, it indicates that the price level is a potential resistance level.
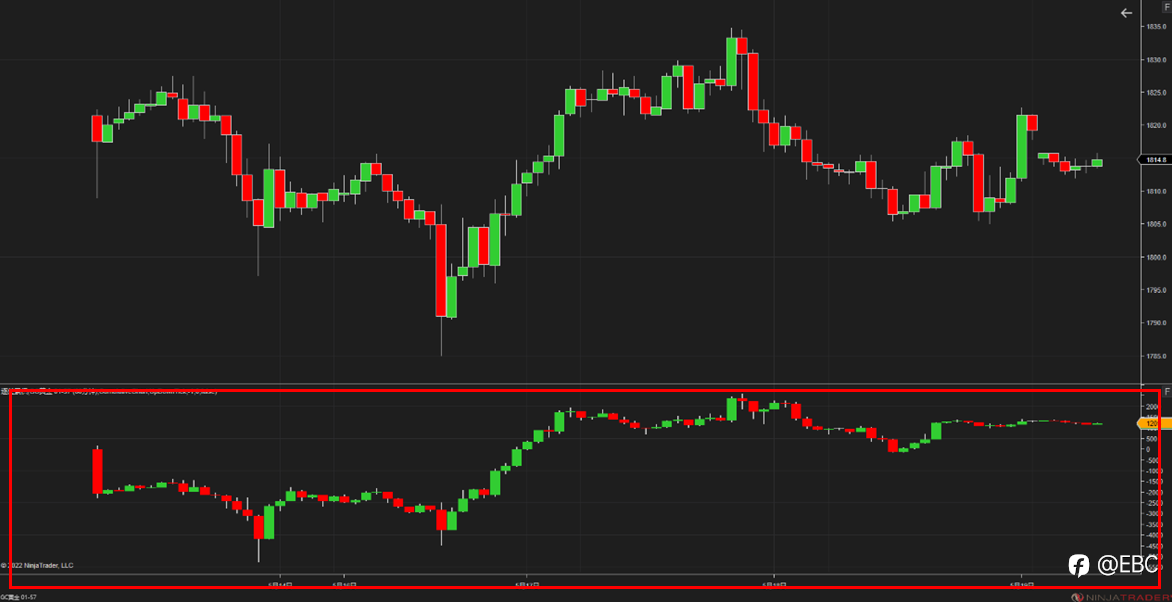
The cumulative difference chart mainly represents the Delta net value (=active buying volume - active selling volume):
If the market is dominated by bulls, Delta is usually positive;
If the market is dominated by bears, Delta is negative.
If the price continues to reach new lows but the strength of delta does not reach new lows, it can be seen as a deviation.
2. Causal principle
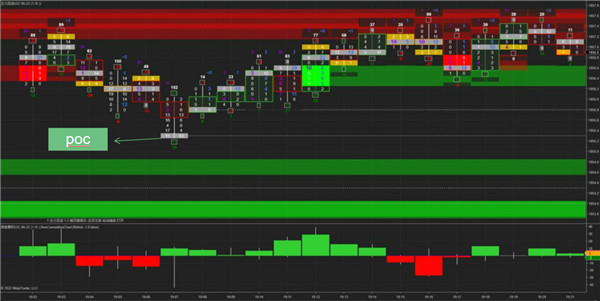
The principle of causality, in simple terms, is to determine the direction of the market through banker's fundraising and distribution.
In EBC's order flow tool, POC reversal can clearly present the banker's fundraising and distribution actions. -
3. Principle of direct ratio between input and output
The unified relationship between quantity and price is also a very important principle in order flow tools.
When there is a large amount of order flow tools that do not rise or fall, or when there is a large increase or decrease in shrinkage, it is often referred to as the inconsistency of quantity and price. Usually, this may mean that the institution begins to take action and, in conjunction with deep commissioned order situations, accurately identifies trend changes, thereby determining the timing of departure and entry.
Although order flow tools are very practical, due to the fact that data sources come from major exchanges and require significant access fees, general investors rarely have access to them. This actually invisibly widens the information gap between investors and institutions.
However, there are exceptions, as EBC Group is one of the few platforms on the market that offers free order flow tools.
Although it is provided for free, the EBC order flow tool is comparable to the ones on the market that charge fees. Firstly, it is the most important source of data. The partners of the EBC order flow tool include CME and the London Metal Exchange, which carry a considerable portion of the world's transactions, so the data provided is more authoritative.

Secondly, the EBC order flow tool incorporates the trading behavior of large institutional market participants. According to the official website explanation, in simple terms, it means analyzing the behavior of the main funds in the market, such as fundraising and distribution, and EA users can conduct follow-up transactions based on this data. -
If you are interested in the EBC order flow tool, you can go to the official website to obtain free collection information.
The Weikov trading method is not only a summary of Weikov's personal trading wisdom, but also integrates the experience core of trading masters such as Livermore, and incorporates more methods with contemporary characteristics in the promotion of Weikov students. This makes Weikov trading method shine brightly at any stage of the development of the trading industry.
This system theory based on the relationship between quantity and price has also become one of the few trading methods among many trading masters that can be effectively quantified, and has led to the emergence of order flow tools, a cross generational trading tool.
Perhaps, as stated in the first step of determining entry timing using the Wickoff trading method: determining the current state of the market and potential future trends. Always maintain reverence for the market, grasp the rules of the market in the constantly changing market, and find a definite main line in the repeated fluctuations, so that we can continue to move forward in the vast sea of trading.
To learn more about the use of order flow tools, please scan the QR code and add customer service!
