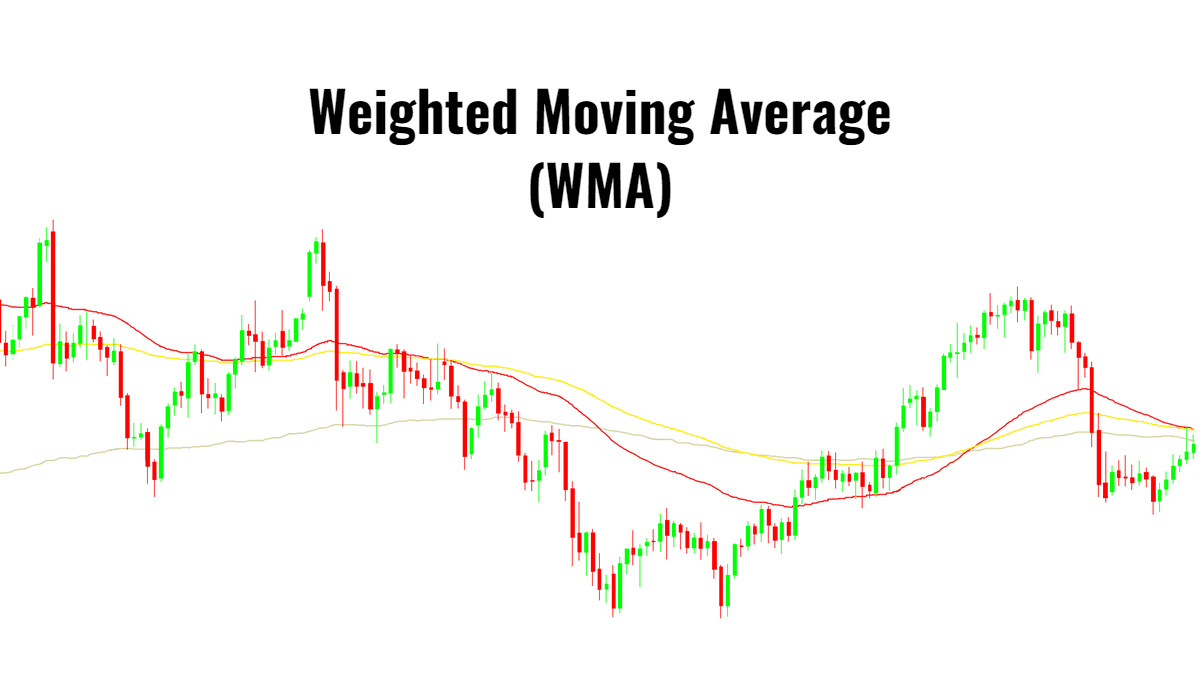
In today’s fast-moving financial markets, traders need tools that can keep up with rapid price changes. The Weighted Moving Average (WMA) stands out for its ability to highlight the most current market momentum, making it a favorite among those who want to react swiftly to new trends and reversals.
What Is a Weighted Moving Average (WMA)?

A Weighted Moving Average (WMA) is a type of moving average that assigns greater importance to the most recent data points in a given period. Unlike the SMA, which treats all prices equally, the WMA multiplies each price by a specific weighting factor.
The most recent price receives the highest weight, and each preceding price receives progressively lower weights. This method ensures that the WMA reacts more quickly to price changes, making it a valuable tool for traders who want to capture trends and reversals as they develop.
How Is the WMA Calculated?
The calculation of a WMA involves multiplying each closing price in the chosen period by a weight. For example, in a 5-day WMA, the most recent day is multiplied by 5, the previous day by 4, and so on, down to 1. The sum of these weighted prices is then divided by the total of the weights (in this case, 1+2+3+4+5 = 15).
WMA Formula:
WMA = (P1 × n + P2 × (n-1) + ... + Pn × 1) / (n + (n-1) + ... + 1)
Where:
P = Price at each period
n = Number of periods
This approach gives the WMA its characteristic responsiveness, allowing it to track price movements more closely than the SMA.
WMA vs. Other Moving Averages
Understanding the differences between the WMA and other moving averages can help traders choose the right tool for their strategy:
Simple Moving Average (SMA): Averages all prices equally, resulting in a smoother but slower-reacting line.
Exponential Moving Average (EMA): Uses an exponential formula to emphasise recent prices, making it even more responsive than the WMA.
The WMA is particularly useful for traders who want a moving average that is more sensitive to recent price changes but not as reactive as the EMA.
How Traders Use the WMA
1) Trend Identification
A primary use of the WMA is to identify the direction of the prevailing trend. When the WMA is sloping upward, it suggests an uptrend; when it is sloping downward, it indicates a downtrend. Because the WMA responds quickly to price changes, it can help traders spot trend reversals earlier than the SMA.
2) Support and Resistance
The WMA can act as a dynamic support or resistance level. In an uptrend, prices may pull back to the WMA before resuming their upward movement. In a downtrend, the WMA can serve as a ceiling that prices struggle to break above.
3) Crossover Strategies
Many traders use WMA crossover strategies to generate buy or sell signals. For example, when a short-term WMA crosses above a longer-term WMA, it may signal a buying opportunity. Conversely, when a short-term WMA crosses below a longer-term WMA, it could indicate a selling opportunity.
4) Short-Term and Long-Term Analysis
Short-period WMAs (such as 5 or 9 days) are popular for day trading and swing trading, as they react quickly to price changes. Longer-period WMAs (such as 50 or 200 days) are used to identify major trend shifts and provide a broader view of market direction.
Pros and Cons of the WMA
Advantages:
More responsive to recent price changes than the SMA
Helps identify trends and reversals earlier
Useful for both short-term and long-term trading strategies
Limitations:
Can be more prone to false signals in choppy or sideways markets
May be “choppier” than the SMA, making trend confirmation harder
Requires careful selection of period length to avoid overreacting to noise
Practical Tips for Using the WMA
Combine with Other Indicators: Use the WMA alongside tools like the Relative Strength Index (RSI) or Moving Average Convergence Divergence (MACD) for confirmation.
Adjust the Period: Experiment with different WMA periods to find the best fit for your trading style and the asset’s volatility.
Backtest Your Strategy: Test your WMA-based strategies on historical data to ensure they perform well in various market conditions.
Risk Management: Always use stop-loss orders and proper position sizing to manage risk, especially when trading with more sensitive indicators like the WMA.
Conclusion
The Weighted Moving Average is a valuable addition to any trader’s toolkit, offering a responsive and insightful way to analyse price trends. By giving more weight to recent prices, the WMA helps traders react quickly to market changes and identify opportunities as they arise.
Whether you’re a short-term trader looking for timely signals or a long-term investor seeking to confirm major trends, the WMA can provide the edge you need to make more informed trading decisions.
Disclaimer: This material is for general information purposes only and is not intended as (and should not be considered to be) financial, investment or other advice on which reliance should be placed. No opinion given in the material constitutes a recommendation by EBC or the author that any particular investment, security, transaction or investment strategy is suitable for any specific person.


