The barriers to entry in the daily chemical industry are not high, but those that are truly extreme are hard to come by. Brands we are familiar with, such as Pantene, Pontil, and Hafez, actually all belong to the same daily chemical giant, Procter & Gamble. As one of the world's three giants of daily chemicals, this company only occupies an important position in the market, and its market capitalization is also perennially among the top. With its solid fundamentals, Procter & Gamble stock has received a lot of attention from investors in recent years. In this article, we will take an in-depth look at the performance and market analysis of Procter & Gamble stock to assess its potential investment value.
 About Procter & Gamble
Procter & Gamble (PG) is a reputable multinational consumer goods company headquartered in Cincinnati, Ohio, USA. The company's products cover a wide range of areas, including personal care and household cleaners, and have had a profound impact on consumers' lifestyles. With extensive market influence and brand recognition, the company's products have become a necessity in the daily lives of billions of people around the world.
Founded in 1837. Procter & Gamble, co-founded by William Procter and James Gamble, has a history of more than 180 years. With its long history and rich portfolio of brands, it holds a significant position in the global consumer goods market. Its innovation and quality assurance have made the company popular worldwide.
The company operates in more than 180 countries and territories worldwide, demonstrating its extensive market reach and brand recognition. Many of its products, such as Crest toothpaste, Prince's laundry detergent, and Pampers nappies, have become necessities in the daily lives of many families. They not only fulfill the daily needs of individuals but also play an important role in promoting public health and household cleanliness, providing reliable products and services to consumers around the world.
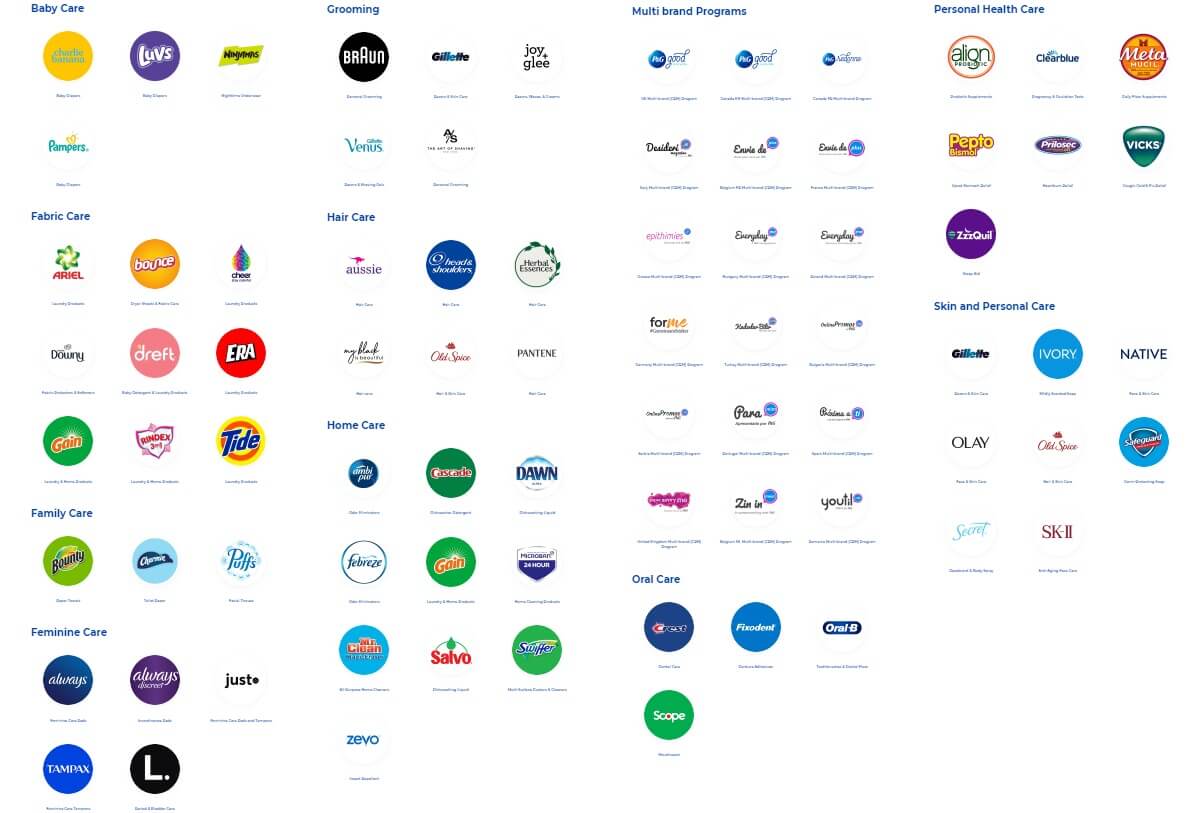
In the personal care sector, Procter & Gamble offers a wide range of products, including shampoos, conditioners, shower gels, and toothpastes. Its major brands, such as Head&Shoulders, Pantene, Safeguard, Crest, Oral-B, Olay, and Gillette, are widely used, and these brands play an important role in daily personal care.
In the household cleaning segment, the company offers a wide range of products such as laundry detergents, cleaners, and dishwashing liquids, and its well-known brands such as Tide, Ariel, and Mr. Clean enjoy high recognition in the market. These brands have become important choices in the household cleaning sector due to their excellent cleaning results and user reputation.
In the healthcare segment, it has products ranging from cold and flu remedies to stomach remedies, with Extraordinary (Vicks) and Procter & Gamble Pharmaceuticals (Pepto-Bismol) being its major brands. These brands continue to meet consumer needs in health care with their effective therapeutic efficacy and wide market acceptance.
Procter & Gamble also excels in baby care, with Pampers nappies and wipes enjoying a high reputation in the market and being the first choice for many families. In feminine care, Always, the leading sanitary towel and pad brand, is not only widely used but also plays a key role in enhancing women's quality of life and meeting consumer needs. These products are not only widely used in their respective fields but also provide consumers with high-quality care solutions.
 The company is committed to product innovation as a core driver. Through continuous investment in research and development, Procter & Gamble continues to introduce high-quality products that meet the evolving needs of consumers. The company's innovations are based not only on deep consumer insights but also on cutting-edge technologies and expert collaborations that have resulted in numerous breakthrough products.
The company also places a high priority on environmental protection and social responsibility and is committed to sustainability as the centerpiece of its business strategy. The company has set ambitious targets, including reducing its environmental footprint, conserving resources, and promoting a circular economy. And it has committed to using 100 percent renewable or recycled materials in all its products and packaging by 2030. while driving this process through responsible sourcing of raw materials and designing energy-efficient and environmentally friendly products.
It will also continue to leverage technological advances to drive product innovation, reduce its carbon footprint, and explore new ways to achieve resource conservation goals. In addition, Procter & Gamble is committed to driving industry change, sharing best practices, and advocating industry-wide standards to shape a more sustainable future for the consumer goods industry.
Procter & Gamble has become a major player in the global consumer goods industry with its high-quality products and strong brand presence. The company holds leadership positions in a number of segments, including personal care, household cleaning, health care, baby care, and feminine care, and its broad brand portfolio and global market reach allow it to play an integral role in the daily lives of consumers.
 Procter & Gamble Stock Investment Assessment
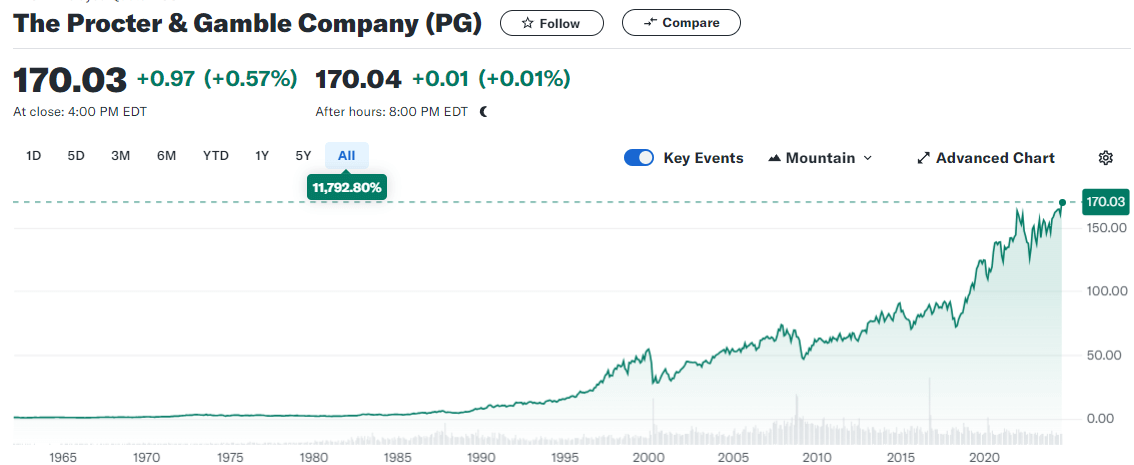
As shown in the chart above, in terms of overall trends, Procter & Gamble stock has demonstrated a significant uptrend since 1990. with its share price increasing by 1.673%, a statistic that underscores the company's long-term stable growth. Such sustained and robust growth indicates that the company has not only successfully met market challenges in the past but also has strong growth momentum for the future, providing investors with a solid long-term investment opportunity.
Over the past 30 years, the company has achieved significant revenue growth of 340% and earnings per share (EPS) growth of 1.065%. In addition, the company's free cash flow and book value have continued to rise, financial metrics that further validate its solid financial position and ability to sustain growth.
According to the August 2024 earnings report, the company's net profit reached $14.879 billion, up 1.54% year-over-year. Despite a significant decline in earnings per share (EPS) in 2015 due to restructuring charges and in 2019 due to goodwill impairment, Procter & Gamble's EPS has maintained a steady growth trend overall. Meanwhile, the company's free cash flow continues to be positive and trending upward, indicating stable operations and good financial health.
In addition, the company has demonstrated strong market competitiveness and business expansion capabilities, achieving significant revenue growth over the past 10 years. At the same time, Procter & Gamble's dividend has grown steadily, reflecting not only its enhanced profitability and solid financial foundation but also the company's continued commitment to shareholder returns.
The company has demonstrated strong defensive characteristics with its leading global market position, diversified brand portfolio, and strong financial performance. While technology stocks typically offer higher potential returns, Procter & Gamble's defensive attributes allow it to demonstrate more stable returns during periods of economic volatility, providing investors with protection against market fluctuations.
However, Procter & Gamble also faces certain operational risks. Among them, supply chain management and cost volatility are major challenges. The company needs to effectively manage its global supply chain and optimize the arrangement of suppliers and manufacturing plants to ensure timely delivery of products and cost control. Meanwhile, fluctuations in raw materials and transport costs may affect the company's profitability.
The company also needs to respond to intense market competition and changes in retail trends, which may put pressure on sales and market share. Changes in customer demand may also affect product sales, while damage to brand reputation may have a significant impact on the company's financial performance, undermining consumer trust and market position.
In addition, Procter & Gamble is also exposed to macroeconomic risks, which mainly include foreign exchange risk, uncertainty in the economic environment, and geopolitical risk. Foreign exchange risk arises primarily from fluctuations in foreign currency exchange rates in international markets, which may have a direct impact on the company's financial performance. Changes in exchange rates may lead to fluctuations in the company's profits in its international operations, which in turn may affect overall financial stability.
Uncertainty in the economic environment is also a major risk factor; for example, high inflation may lead to a reduction in consumer spending, which could have a negative impact on the company's sales performance. Also, geopolitical risks such as sanctions and tax changes may adversely affect the company's operations, increasing operating costs and overall risk. These risk factors need to be fully considered by the company in its strategic planning and risk management.
However, these risks also do not detract from Procter & Gamble's investment value, which provides investors with a solid investment opportunity thanks to its remarkable financial performance and long track record of stable growth. The company's strong market position, continued ability to innovate, and broad reach in the global marketplace make it a noteworthy investment. Moreover, its solid financial performance and stable growth potential demonstrate its attractiveness as a long-term investment.
As such, it is particularly suited to long-term investors looking for stable returns. While it may offer lower returns compared to technology stocks, it is also significantly less risky. The company's solid position in the market and continued business growth make it an ideal choice for defensive investments. Its stock can provide a steady income to a portfolio, making it especially suitable for investors who want to maintain steady returns through market volatility.
By including Procter & Gamble stock in a portfolio, investors are able to take advantage of its sustained cash flow and steady growth potential, thereby reducing overall investment risk. And its defensive attributes and financial soundness provide investors with protection in times of economic uncertainty, making it a solid investment choice.
Procter & Gamble Stock Current Analysis Report
In its August 2024 earnings report, Procter & Gamble demonstrated solid financial performance. The company reported net income of $14.879 billion, up 1.54% year-over-year, and operating income of $84.039 billion, up 2.48% year-over-year. Basic earnings per share came in at $6.18. indicating that the company has done well in maintaining strong profitability.
In terms of debt, Procter & Gamble's total debt was $71.81 billion, of which $7.191 billion was short-term debt. The company has maintained a healthy financial structure through effective financial management and cost control, further strengthening its stable position in the global market. This financial soundness supports the company's long-term stable growth in the market.
Fundamentally, Procter & Gamble has significant market share in the home and personal care products segment. For example, its global market share for razors is more than 60 percent, while its baby care brand Pampers holds a 20 percent market share in this segment. These figures highlight Procter & Gamble's strong presence in the global consumer goods market.
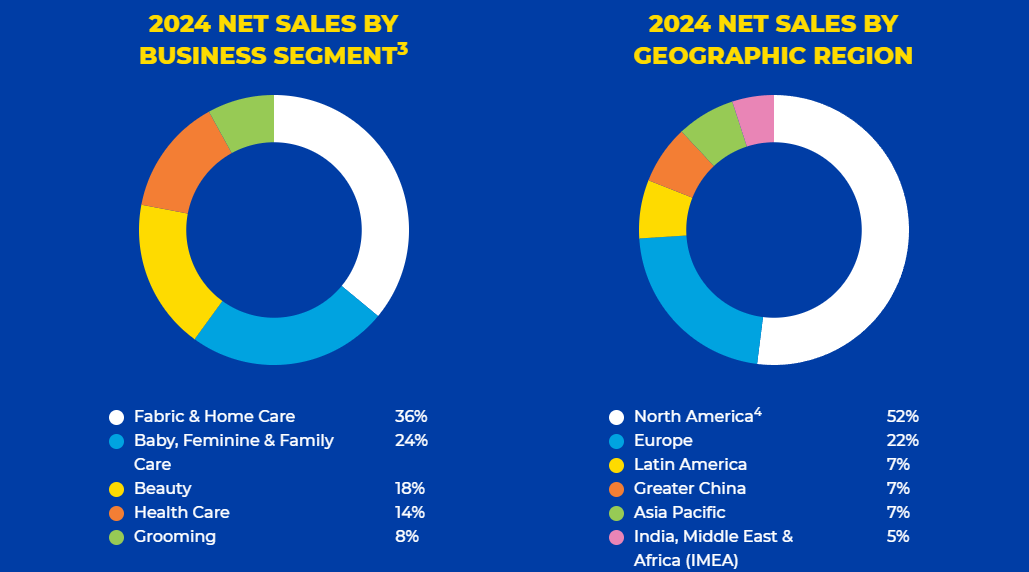
In terms of regional distribution, as shown above. North America is the company's main source of revenue, accounting for 52 percent of total revenue. Europe contributes 22 percent, Greater China 7 percent, Asia Pacific 7 percent, Latin America 7 percent, and India, the Middle East, and Africa 5 percent. These regional distributions demonstrate the company's broad coverage of the global market and reflect the strategic success of its globalized operations.
Analyzing the K-line trend, Procter & Gamble's daily K-line chart shows a long alignment with the averages showing a clear upward trend. Despite the sharp decline in the three major US stock indices on 30 and 31 July, the company's share price quickly rebounded to the support level, indicating that the market has full confidence in it and the overall momentum remains strong.
The weekly K-line chart shows that the company's share price has a stable long-term trend, with the averages aligned in a bullish manner, and although it is rising slowly, the trend is in a'slow bull’ mode, which shows the market's confidence in its stable growth. The monthly K-line chart reflects a standard and rising gold line, indicating strong long-term growth potential and solid market confidence in the company's stock.
From the technical analysis, the pressure level of Procter & Gamble stock in the daily chart is located at $168. Although the stock has attempted to break through this pressure level and reached recent highs at $170. it has not yet succeeded in doing so, indicating significant resistance in this area. This situation suggests that the $168-$170 range is putting more pressure on the stock and may require more market force to break through.
The support level, on the other hand, shows that the stock bounced back quickly after hitting it during the market's decline, which suggests that the support level has strong validity. This support level provides an important supportive role for the stock, helping to prevent further price declines and boosting the market's confidence in this price level.
In the short-term technical chart (120-minute K chart), the current pressure level for Procter & Gamble stock is located at $170. If the stock can effectively break above this key level, further upside is expected. A breakout above $170 could usher in a new round of gains in the stock, propelling it towards higher target levels and greater potential gains for investors.
In short-term trend analysis, the 15-minute K-chart shows $170 as a major pressure level for the stock. The stock has made several attempts to break above this level recently but has been unsuccessful. Investors should keep a close eye on the movement of this key position, as an effective break above $170 could lead to further upside opportunities.
All in all, Procter & Gamble has shown strong resilience and stability amidst the volatility of the stock market, demonstrating its continued good performance in the stock market. Although $170 is the current short-term pressure level, the overall trend remains bullish. Investors should keep an eye on whether the company is able to break through this pressure level in order to adjust its investment strategy.
Procter & Gamble Stock Performance and Market Analysis
| Aspects |
Description |
Analysis |
| Company Overview |
Global chemical giant with many brands. |
High potential for long-term growth. |
| Stock Price Trend |
Up 1673% since 1990. |
Demonstrates long-term stable growth. |
| Financials |
Net income of $14.879B in 2024, up 1.54%. |
Financially sound with stable dividend. |
| Market Performance |
Stock at $170, strong support. |
Needs to break $170; bullish long-term. |
| Investment Value |
Solid fundamentals, strong market position. |
High long-term investment potential. |
Disclaimer: This material is for general information purposes only and is not intended as (and should not be considered to be) financial, investment, or other advice on which reliance should be placed. No opinion given in the material constitutes a recommendation by EBC or the author that any particular investment, security, transaction, or investment strategy is suitable for any specific person.


 About Procter & Gamble
 The company is committed to product innovation as a core driver. Through continuous investment in research and development, Procter & Gamble continues to introduce high-quality products that meet the evolving needs of consumers. The company's innovations are based not only on deep consumer insights but also on cutting-edge technologies and expert collaborations that have resulted in numerous breakthrough products.
 Procter & Gamble Stock Investment Assessment

