In technical analysis, traders use many tools to help them identify market trends, price reversals, and potential entry and exit points. One of these tools is the Zig Zag Indicator, a simple yet effective tool that can help traders filter out market noise and spot the underlying trends more clearly.
By focusing on the most significant price movements, the indicator allows traders to effortlessly identify the key peaks and troughs in a price chart, helping them make more informed trading decisions.
Understanding the Zig Zag Indicator

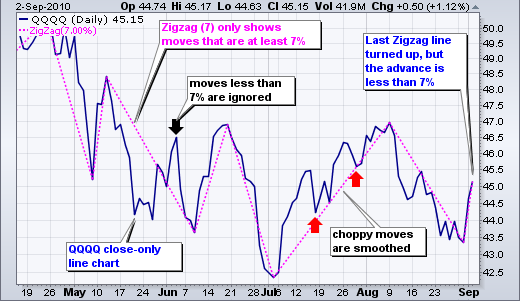
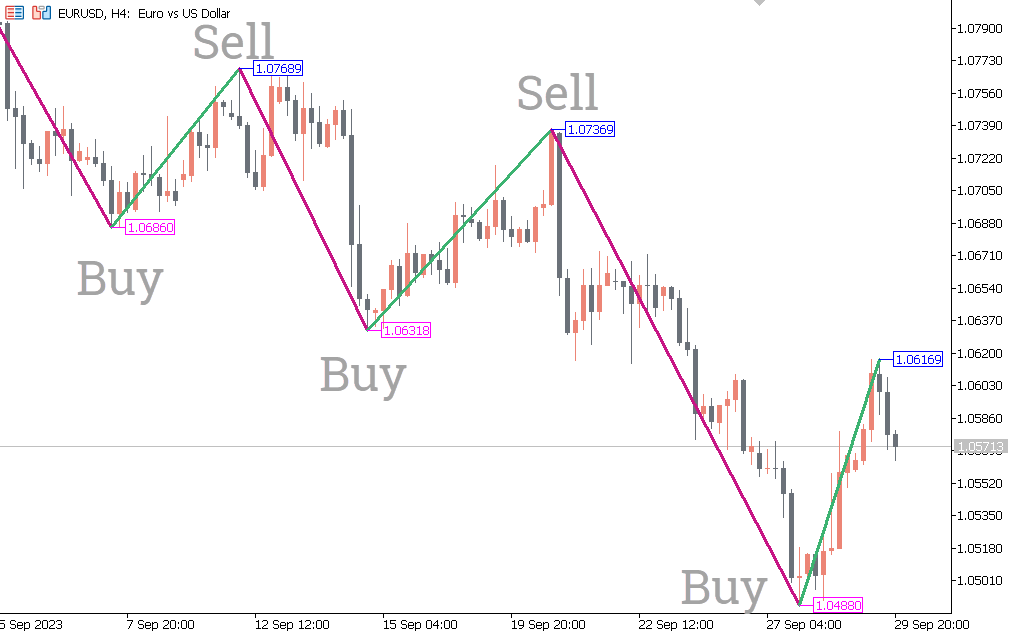
At its core, the Zig Zag indicator is a simple line chart that connects the significant peaks and troughs of a security's price. The indicator does not plot every price movement, but rather, it skips over smaller price changes that are not considered important. This makes it particularly useful for identifying massive trend changes and understanding the market's broader movements.
The indicator works by setting a specific percentage or point value (referred to as the "Zig Zag percentage" or "threshold") that defines the minimum price movement required to create a new peak or trough. For example, if you set a Zig Zag percentage of 5%, the indicator will only plot a new peak or trough if the price moves at least 5% from the previous peak or trough. This ensures that only significant price movements are shown, eliminating the noise created by minor fluctuations.
The primary purpose of the indicator is to help traders identify the market's overall direction. By connecting the peaks and troughs, the indicator makes it easier to see if a market is in an uptrend, downtrend, or sideways movement. It can also be used to spot potential reversals and identify support and resistance levels.
How Does it Work?
Firstly, the indicator applies a set threshold determining the minimum price movement needed for a trend change. This threshold can be set as a percentage or in points (based on the price of the underlying asset). For instance, if you set the threshold to 10%, the indicator will only show a change in trend once the price has moved 10% in either direction.
Once the threshold is set, the indicator starts tracking price movements. It begins by plotting a line from the most recent significant peak or trough and waits for a price move. Once the price has moved enough to meet the threshold, the indicator creates a new peak or trough and connects it to the previous point. This process continues as long as the price moves in the market, with the indicator creating new peaks and troughs whenever the price moves enough to meet the threshold.
The indicator does not attempt to predict future price movements; rather, it helps traders focus on the crucial price points likely to define the market's direction. For instance, it eliminates the smaller price movements that can obscure the overall trend, allowing traders to spot the big directional shifts better.
For example, during a market uptrend, the indicator would plot a series of higher highs (peaks) and higher lows (troughs). Similarly, the indicator would plot lower highs and lower lows in downtrends. In a sideways market, the indicator would plot a series of alternating peaks and troughs without a clear upward or downward direction.
How to Use the Zig Zag Indicator in Your Trading Strategy

1) Identifying Trends
One of the most straightforward uses of the Zig Zag indicator is to identify the overall market trend. When the indicator plots a series of higher highs and higher lows, it indicates that the market is in an uptrend. Conversely, when the indicator plots lower highs and lower lows, it shows that the market is in a downtrend. In a sideways market, the indicator will display alternating peaks and troughs with no clear upward or downward direction.
By focusing on the indicator's plot of significant peaks and troughs, traders can understand the market's direction and adjust their trading strategies accordingly. For example, traders may choose to go long in an uptrend, short in a downtrend, and avoid trading in a sideways market.
2) Spotting Trend Reversals
The Zig Zag indicator is also helpful for spotting potential trend reversals. A reversal occurs when the price moves in the opposite direction of the current trend. For example, in uptrends, a reversal would be indicated when the price starts to decline significantly and breaks below the previous low.
The Zig Zag Indicator helps traders spot these reversal points by highlighting the significant peaks and troughs. When a new peak or trough is formed in the opposite direction of the previous trend, it may signal a reversal. This can be a valuable signal for traders who want to enter the market at the beginning of a new trend or avoid continuing to trade in a market that is about to reverse.
3) Defining Support and Resistance Levels
Moreover, the indicator can also define key support and resistance levels. These levels are crucial in technical analysis because they represent price points where the market has previously reversed or consolidated.
Support levels are price levels where the price has historically found buying interest, causing the price to rise. Resistance levels are price levels where the price has historically encountered selling pressure, causing the price to fall. By identifying these key levels with the indicator, traders can gain insights into potential price barriers that may influence future price movements.
4) Combine with Other Indicators
While the Zig Zag indicator is superb, it is often best used with other technical indicators to confirm signals and enhance trading strategies. For example, traders might use it with trend-following indicators like moving averages or momentum indicators like the Relative Strength Index (RSI).
By using multiple indicators, traders can improve the accuracy of their trading decisions. For example, if the Zig Zag indicator signals a potential reversal and the RSI shows that the market is oversold, this may be a stronger indication that the trend is about to reverse.
Conclusion
In conclusion, the Zig Zag indicator is a valuable tool for traders who want to spot trends, identify trend reversals, and highlight key support and resistance levels with greater clarity. By filtering out small price movements, it helps traders focus on the most significant trends, making it easier to understand market direction and make more informed decisions.
While it is a lagging indicator and can sometimes generate false signals, the Zig Zag Indicator can be a powerful addition to your trading toolbox when used with other technical indicators and sound risk management strategies.
Disclaimer: This material is for general information purposes only and is not intended as (and should not be considered to be) financial, investment or other advice on which reliance should be placed. No opinion given in the material constitutes a recommendation by EBC or the author that any particular investment, security, transaction or investment strategy is suitable for any specific person.


