Understanding the KDJ Indicator
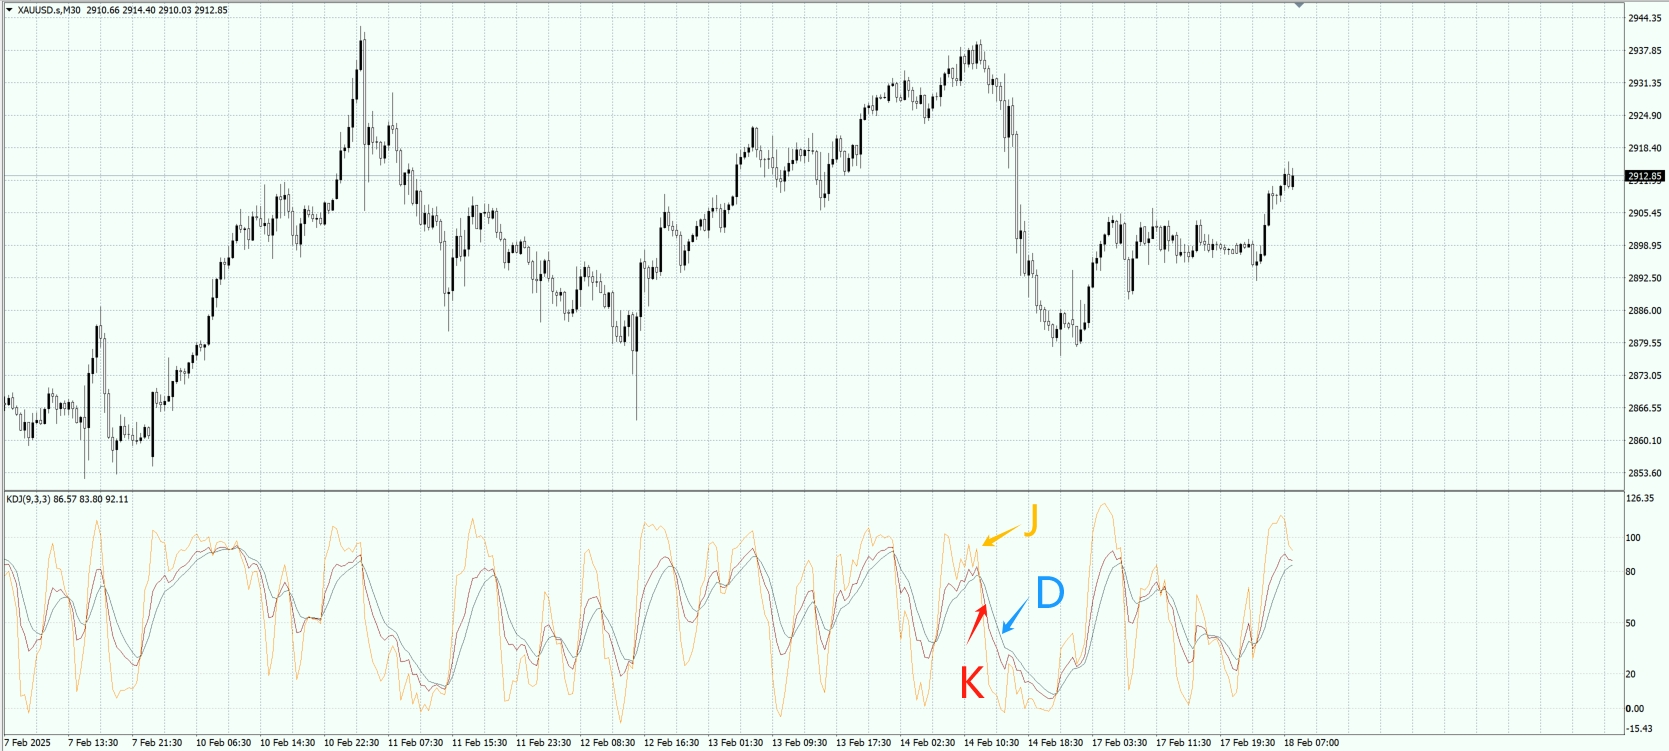
The KDJ indicator is a valuable tool for traders who want to identify market trends and potential reversals. It comprises three key components: the K, D, and J lines. Each plays a distinct role in analysing price movements, providing insights into market conditions, and assisting traders in making informed decisions.
The K line represents the current market position relative to a specified trading range. It reacts quickly to price movements, making it highly responsive to changes. The D line, which is a moving average of K, smooths out fluctuations and offers a clearer picture of overall market trends. The J line, derived from the K and D values, highlights potential divergences between the two, often indicating possible reversals. Together, these three lines help traders assess market momentum, overbought and oversold conditions, and potential entry and exit points.

Calculating the KDJ Indicator
The KDJ indicator is calculated using the Raw Stochastic Value (RSV), which measures the current closing price with the highest and lowest prices over a selected period. the highest and lowest prices over a selected period. The K value is obtained by applying a three-day moving average to the RSV, filtering out short-term fluctuations for a more stable signal. The D line is then calculated by taking another three-day moving average, this time of the K value, further smoothing the data.
The J line is determined using the formula: J = 3 * K - 2 * D. This calculation amplifies the difference between the K and D lines, making it a crucial tool for identifying market reversals. Traders who understand this process can better interpret KDJ signals and use them effectively in their trading strategies.
Interpreting KDJ Signals
To make the most of the KDJ indicator, traders must understand how to interpret its signals. The indicator is particularly useful for spotting overbought and oversold market conditions. When the D line falls below 30, the market is considered oversold, suggesting that the asset might be undervalued and presenting a potential buying opportunity. Conversely, a D value above 70 indicates overbought conditions, which may signal an impending price decline.
Crossovers between the K and D lines provide further insights into market movements. A "golden cross" occurs when the K line crosses above the D line, indicating a bullish trend and a possible buying opportunity. On the other hand, a "death cross" happens when the K line falls below the D line, suggesting potential selling pressure. The J line also plays a role in market analysis. When it rises above 90, it indicates a short-term peak, whereas a J value below 10 signals a possible market bottom.

Applying KDJ in Trading Strategies
Incorporating the KDJ indicator into a trading strategy can provide a significant advantage. A common method involves using crossover signals, where the K line crossing above the D line suggests a bullish trend, while a downward crossover indicates a bearish sentiment. These signals can help traders identify potential entry and exit points.
While the KDJ indicator is a powerful tool, relying solely on it can be risky. To enhance trading accuracy, many traders combine it with other technical indicators, such as Moving Averages or the Relative Strength Index (RSI). This approach reduces the likelihood of false signals and provides a more comprehensive analysis of market trends. The KDJ indicator is often preferred over the MACD for short-term trading due to its greater sensitivity to price movements, making it ideal for volatile market conditions.
Adjusting KDJ Settings for Different Market Conditions
To optimise the effectiveness of the KDJ indicator, it is essential to adjust its settings based on market conditions. The default setting (9,3,3) serves as a general benchmark, but traders can modify these parameters to suit different trading styles and volatility levels.
Longer settings, such as (14,3,3), provide more reliable signals by reducing market noise, though this may lead to fewer trading opportunities. Conversely, shorter settings, such as (5,3,3), increase signal frequency, which can be useful in highly volatile markets but may result in a higher risk of false signals. Finding the right balance is crucial for maximising the accuracy of trading decisions.
Comparing KDJ with Other Technical Indicators
The KDJ indicator stands out from other technical analysis tools due to its incorporation of the J line, which provides additional signal confirmation. Unlike traditional stochastic oscillators that use only two lines, the J line enhances the KDJ’s ability to identify price movement intensity.
Compared to moving averages, the KDJ indicator is more responsive to market changes, enabling traders to react faster to potential reversals. It integrates elements of the Williams R indicator, making it highly effective for short-term trading. By generating early signals, the KDJ allows traders to take advantage of market trends before they fully develop.

Limitations and Precautions
While the KDJ indicator is a powerful tool, it is not without limitations. In highly volatile markets, it can generate misleading signals, requiring careful interpretation. Sharp price fluctuations can reduce its accuracy, making it crucial to validate KDJ signals with other technical indicators.
Using the KDJ indicator alongside other tools, such as trend lines or support and resistance levels, can improve reliability. This multi-indicator approach helps traders confirm signals and avoid making decisions based solely on one indicator, ultimately leading to better trading outcomes.
Conclusion
Mastering the KDJ indicator can significantly enhance a trader’s ability to identify market trends and potential reversals. With its unique combination of K, D, and J lines, it provides valuable insights into price momentum and overbought/oversold conditions. However, to maximise its effectiveness, traders should adjust its settings to suit different market environments and combine it with additional indicators.
Understanding the strengths and limitations of the KDJ indicator allows traders to make informed decisions and improve their overall trading performance. By integrating it into a well-rounded strategy, traders can navigate the markets more effectively and enhance their chances of success.
Disclaimer: This material is for general information purposes only and is not intended as (and should not be considered to be) financial, investment or other advice on which reliance should be placed. No opinion given in the material constitutes a recommendation by EBC or the author that any particular investment, security, transaction or investment strategy is suitable for any specific person.


