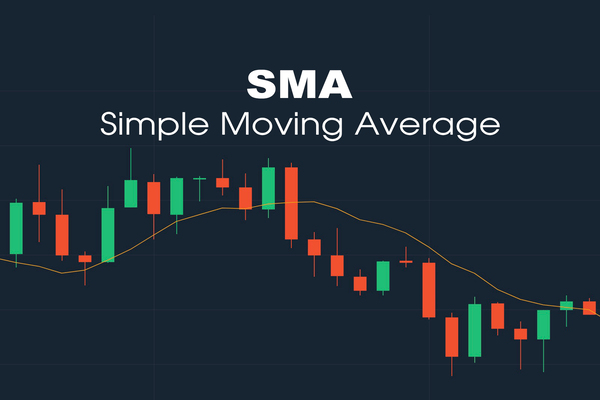
The golden cross is a widely used bullish chart pattern for traders to signal a potential shift from a downtrend to an uptrend. It occurs when a short-term moving average, typically the 50-day simple moving average (SMA), crosses above a long-term moving average, commonly the 200-day SMA.
This crossover suggests increasing momentum and is often interpreted as a strong buy signal by traders and investors.
What Is the Golden Cross?

The golden cross unfolds in three distinct phases. Initially, the market experiences a downtrend, where the short-term moving average remains below the long-term moving average. As the market begins to recover, the short-term moving average rises and eventually crosses above the long-term moving average, forming the pattern.
This crossover indicates a potential reversal in market sentiment from bearish to bullish. The final phase involves continuing the uptrend, with the long-term moving average acting as a support level.
This pattern is considered more reliable when accompanied by high trading volumes, reflecting strong market participation and conviction in the new trend.
How to Implement the Golden Cross in Trading
To effectively trade the pattern, traders should consider the following steps:
First, identify the formation of the golden cross by observing when the 50-day moving average crosses above the 200-day moving average. This crossover should be confirmed by increased trading volume, indicating strong market interest and momentum.
Next, analyse the overall market context and look for additional bullish signals. These may include higher highs and higher lows in price action, as well as confirmation from other technical indicators such as the Relative Strength Index (RSI) or Moving Average Convergence Divergence (MACD)
Once you confirm the pattern with other indicators, determine appropriate entry and exit points. Establish entry points after a minor price pullback to the moving averages or a breakout above a recent resistance level. Exit points should be based on predetermined profit targets or signals of trend reversal, such as the Death Cross formation (where the 50-day moving average crosses below the 200-day moving average).
Trading Strategies for the Golden Cross

Traders can employ many strategies to capitalise on the golden cross pattern.
1) Breakout confirmation strategy: Enter a long position once the price breaks above a significant resistance level following the golden cross. This method relies on confirming the uptrend and aims to capture substantial price movements.
2) Waiting for a pullback after the crossover: Instead of entering the trade immediately, traders wait for the price to retrace towards the moving averages, providing a better entry point with reduced risk. This approach is reliable in volatile markets where prices may temporarily reverse before continuing the uptrend.
3) Combining the Golden Cross with other technical indicators: Using it with the Relative Strength Index (RSI) or Moving Average Convergence Divergence (MACD) can enhance the effectiveness of the strategy. These indicators help assess the trend's strength and identify potential overbought or oversold conditions, allowing traders to make more informed decisions.
Real-World Applications
The golden cross has been observed in various markets and has often preceded significant price increases. For instance, in March 2025, Boeing's stock exhibited a golden cross as its 50-day moving average crossed the 200-day moving average. This technical indicator suggested a bullish momentum, coinciding with positive remarks from the company's CFO and new aircraft orders. Following this crossover, Boeing's stock experienced its most one-day gain since 2023, closing at $172.62.
Similarly, Tesla's stock formed a golden cross in January 2025, with its 50-day moving average surpassing the 200-day moving average. This bullish signal emerged after a decline, suggesting a potential reversal. Analysts pointed to anticipated strong vehicle deliveries and upcoming product unveilings as catalysts for this positive movement.
These examples underscore the potential of the pattern to signal significant bullish trends when combined with favourable fundamental developments.
Risk Management and Limitations
While the golden cross is a powerful tool, it's essential to acknowledge its limitations and implement proper risk management techniques. As a lagging indicator, the pattern may provide signals after a significant portion of the price movement has already occurred, potentially leading to suboptimal entry points.
Moreover, false signals can occur, especially in sideways or choppy markets, resulting in potential losses. To mitigate these risks, traders should employ stop-loss orders to limit potential losses if the trade moves against them. Setting a stop-loss below the 200-day SMA or a recent support level can provide a safety net.
Additionally, a trailing stop-loss can help lock in profits as the price rises. It's also advisable to define clear profit targets and maintain a favourable risk-to-reward ratio to ensure that potential gains outweigh potential losses.
Conclusion
In conclusion, the golden cross is a valuable pattern in technical analysis, offering insights into potential bullish market reversals. By understanding its formation, confirming signals with additional indicators, and implementing sound trading strategies and risk management practices, traders can effectively harness the pattern's power.
However, it's crucial to remain vigilant and not rely solely on this pattern, as market conditions can change rapidly, and no indicator guarantees success. Continuous learning, disciplined execution, and adaptability are key to successful trading using the golden cross pattern.
Disclaimer: This material is for general information purposes only and is not intended as (and should not be considered to be) financial, investment or other advice on which reliance should be placed. No opinion given in the material constitutes a recommendation by EBC or the author that any particular investment, security, transaction or investment strategy is suitable for any specific person.