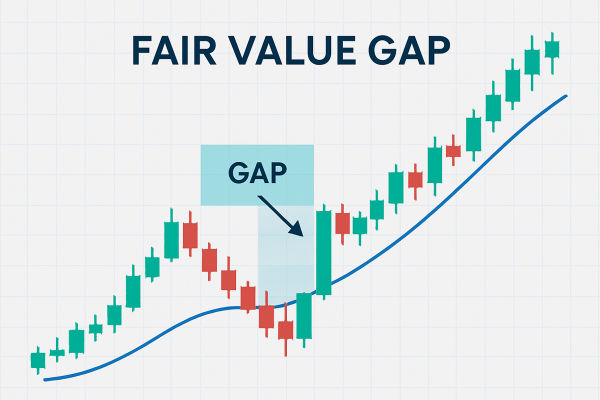
In the fast-paced world of financial markets, traders need indicators that can quickly adapt to changing conditions. The Exponential Moving Average (EMA) has become a staple tool for technical analysts who require more responsive trend identification than traditional moving averages provide.
By placing greater emphasis on recent price action, the EMA helps traders identify emerging trends earlier and react more swiftly to market developments.
What Is Exponential Moving Average?

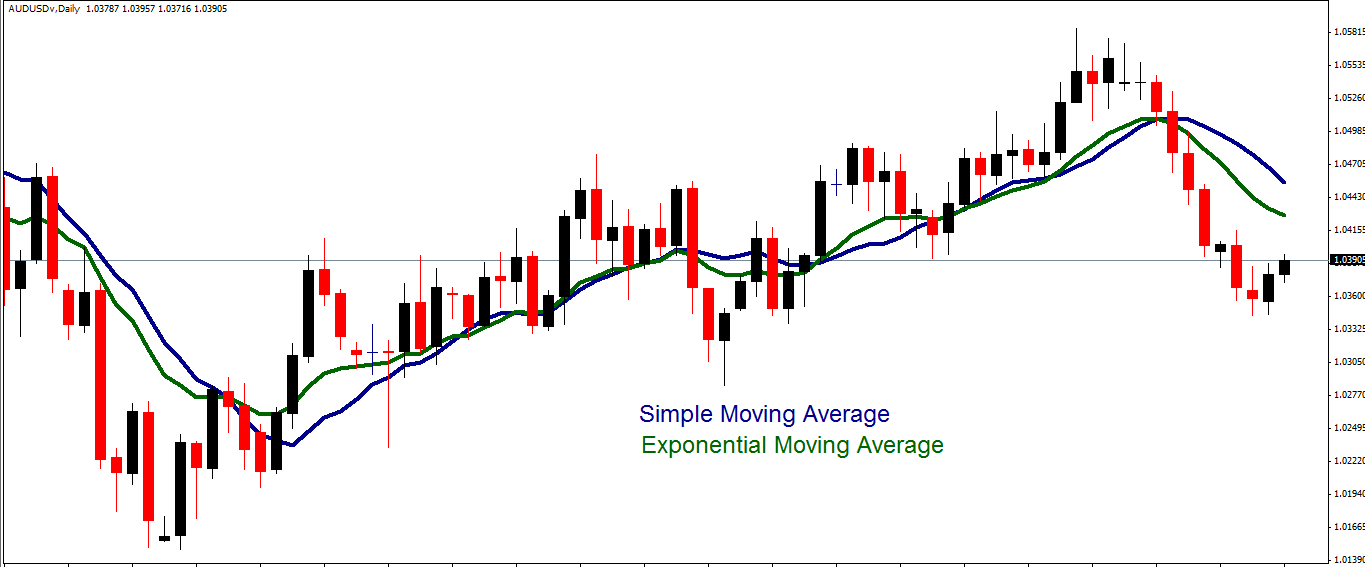
The Exponential Moving Average is a type of moving average that places a greater weight and significance on the most recent data points. Unlike the Simple Moving Average (SMA) which applies equal weight to all observations in the calculation period, the EMA emphasises recent price changes, making it more responsive to new information and current market conditions.
This weighted approach allows the EMA to adapt more quickly to price changes, reducing the lag typically associated with moving averages. The EMA is also referred to as the exponentially weighted moving average, highlighting its unique calculation method that prioritises recent market activity.
How EMA Is Calculated
The EMA uses a more complex formula than the SMA, incorporating a multiplier that gives greater weight to recent prices:
EMA = (Current Price × Multiplier) + [Previous EMA × (1 − Multiplier)]
Where the multiplier is calculated as:
Multiplier = 2
--------------------------------
(Number of periods + 1)
For example, in a 20-day EMA, the multiplier would be 2/(20+1) = 0.0952. This means the current price has a 9.52% influence on the new EMA value.
The calculation requires an initial EMA value, which is typically the SMA of the first n periods. Once established, the formula can be applied to each subsequent period, continuously updating the EMA as new price data becomes available.
EMA vs. Simple Moving Average
The primary difference between the EMA and SMA lies in their responsiveness to price changes:
Responsiveness: The EMA reacts more quickly to recent price changes, while the SMA responds more slowly due to equal weighting.
Lag reduction: The EMA has less lag than a comparable SMA, potentially identifying trend changes earlier.
Sensitivity: The EMA is more sensitive to price volatility, which can be both an advantage and disadvantage depending on trading style.
Calculation complexity: The EMA requires more complex calculations than the straightforward averaging used in the SMA.
When the market is trending strongly, the EMA's responsiveness can help traders enter positions earlier than they might with an SMA. However, in choppy or sideways markets, this same sensitivity may generate more false signals.
Common EMA Periods and Their Applications
Traders typically use various EMA periods depending on their trading timeframe and objectives:
Short-term EMAs (8, 12, 21 days): Highly responsive to price changes, ideal for day trading and short-term strategies
Medium-term EMAs (50 days): Balanced between responsiveness and stability, useful for swing trading
Long-term EMAs (100, 200 days): Less sensitive to short-term fluctuations, helpful for identifying major trend changes and long-term market direction
The choice of EMA period should align with your trading timeframe—shorter periods for shorter timeframes and longer periods for longer-term analysis.
Trading Strategies Using EMA
EMA Crossover Strategy
One of the most popular EMA strategies involves monitoring crossovers between EMAs of different periods:
Golden Cross: When a shorter-term EMA crosses above a longer-term EMA, generating a bullish signal that suggests potential upward price movement
Death Cross: When a shorter-term EMA crosses below a longer-term EMA, producing a bearish signal that indicates potential downward price movement
Common EMA combinations for crossover strategies include 9/21, 12/26, and 50/200 periods.
EMA Bounce Strategy
The EMA often acts as a dynamic support or resistance level:
In uptrends, prices tend to "bounce" off the EMA when pulling back
In downtrends, the EMA frequently serves as resistance when prices rally
Traders look for price to touch the EMA and then continue in the direction of the trend, using this interaction as a signal to enter trades.
Multiple EMA Strategy
Using three or more EMAs can provide a more comprehensive view of market trends:
When short, medium, and long-term EMAs (such as 9, 21, and 55-day) are aligned in order, it confirms a strong trend
The relative positions of multiple EMAs can indicate trend strength and potential reversals
This approach helps traders stay in trends longer and avoid premature exits
Trend-Following Strategy
The slope of the EMA line itself provides valuable trend information:
Rising EMA suggests a bullish trend
Falling EMA indicates a bearish trend
Flattening EMA may signal a potential trend change or consolidation
Combining EMA with Other Indicators
The EMA works well when combined with other technical indicators:
EMA + RSI: The Relative Strength Index helps identify overbought or oversold conditions, which can confirm EMA-based signals
EMA + MACD: Since the Moving Average Convergence Divergence is derived from EMAs, this combination provides complementary insights into momentum and trend direction
EMA + Price Action: Analysing candlestick patterns at EMA interaction points can enhance entry and exit timing
Advantages of Using EMA
More responsive to recent price changes than SMA
Adapts quickly to changing market conditions
Reduces lag in trend identification
Works across all financial markets and timeframes
Provides dynamic support and resistance levels
Limitations to Consider
More susceptible to false signals in volatile markets
Can be overly responsive during sideways price action
Requires more complex calculations than SMA
Past performance doesn't guarantee future results
Should not be used in isolation for trading decisions
Conclusion
In conclusion, the EMA is versatile enough to be applied across various financial instruments including stocks, forex, commodities, and cryptocurrencies. It works on multiple timeframes from minute charts for day trading to weekly charts for long-term investing.
For day traders, shorter EMAs (8-21 periods) on minute or hourly charts can help identify intraday trends, while investors might focus on 50, 100, or 200-day EMAs on daily charts to determine longer-term market direction.
Disclaimer: This material is for general information purposes only and is not intended as (and should not be considered to be) financial, investment or other advice on which reliance should be placed. No opinion given in the material constitutes a recommendation by EBC or the author that any particular investment, security, transaction or investment strategy is suitable for any specific person.


