In the complex world of financial markets, successful traders rely on technical indicators to make informed decisions. Among these tools, the Simple Moving Average (SMA) stands out for its clarity, versatility, and effectiveness in identifying market trends.
Whether you're trading forex pairs, commodities, or global indices on EBC's platform, understanding how to interpret and apply SMAs can significantly enhance your trading strategy.
What Is Simple Moving Average?

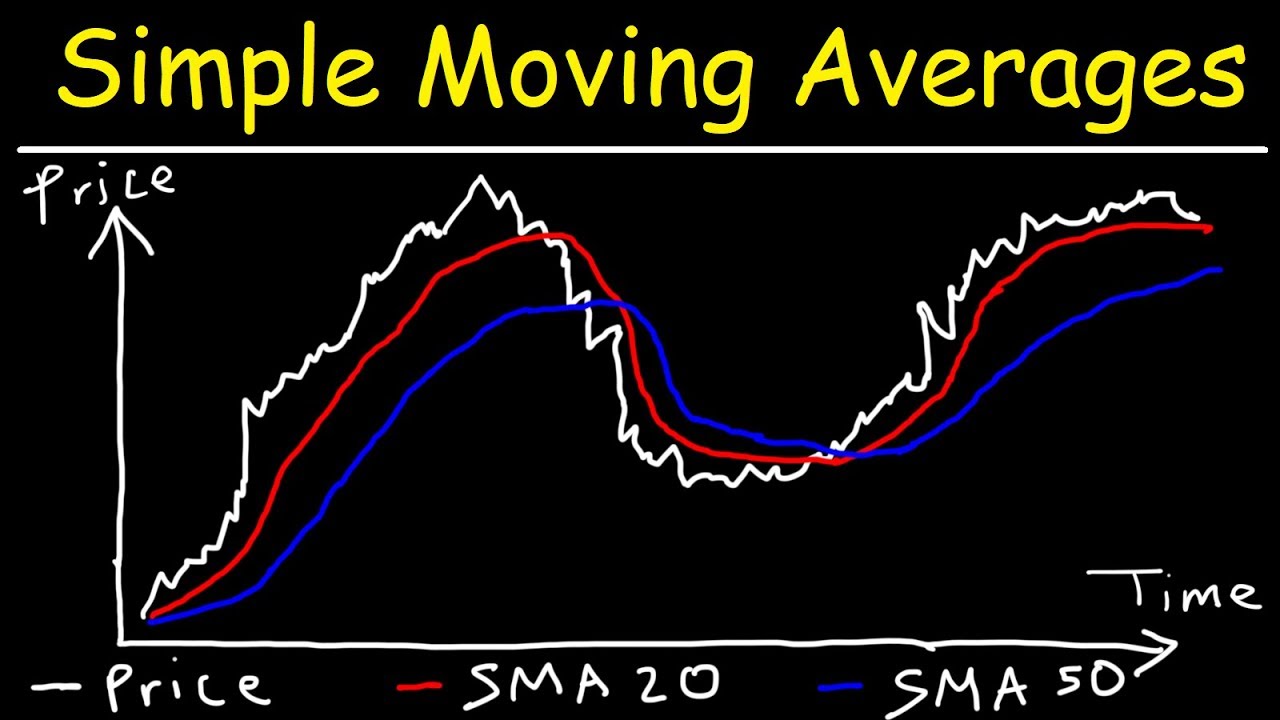
The Simple Moving Average (SMA) is a foundational technical analysis tool that calculates the average price of an asset over a specified time period. By adding closing prices and dividing by the number of periods, the SMA creates a smoothed line that helps traders identify trends while filtering out market noise.
How SMA Is Calculated
The SMA uses a straightforward formula:
SMA=nA1+A2+...+An
Where:
A = The price (typically closing price) in each period
n = The number of time periods
For example, a 20-day SMA adds the closing prices for all 20 days and divides by 20. As each new trading day occurs, the calculation drops the oldest price and adds the newest, causing the average to "move" with current market conditions.
Common SMA Periods and Their Uses
Different SMA lengths serve various analytical purposes:
Short-term SMAs (5-20 periods): More responsive to recent price changes, ideal for short-term trading
Medium-term SMAs (50 periods): Balance between reactivity and stability
Long-term SMAs (100-200 periods): Identify major market trends and potential support/resistance levels
The 200-day SMA is particularly significant, often considered the dividing line between bull and bear markets in many financial instruments.
Trading Strategies Using SMA
Trend Identification
Upward-sloping SMA indicates bullish trend
Downward-sloping SMA suggests bearish trend
Price consistently above SMA confirms uptrend
Price consistently below SMA confirms downtrend
SMA Crossovers
Golden Cross: Short-term SMA crosses above long-term SMA (bullish)
Death Cross: Short-term SMA crosses below long-term SMA (bearish)
Common combinations include 5/20, 10/50, and 50/200 period crossovers
Support and Resistance
Major SMAs often function as dynamic support in uptrends or resistance in downtrends, creating potential entry and exit points when price interacts with these levels.
Multiple SMA Analysis
Using several SMAs simultaneously (like 20, 50, and 200-period) provides a more comprehensive view of market trends across different timeframes.
Advantages of Using SMA
Easy to calculate and understand
Effectively identifies overall trend direction
Filters out short-term price fluctuations
Works across all financial markets and timeframes
Provides objective reference points for trading decisions
Limitations to Consider
Lagging indicator that reflects past price action
Can generate false signals during sideways markets
Equal weighting means slower reaction to recent price changes
Susceptible to distortion from price spikes
Applying SMA to Your EBC Trading
When trading forex, commodities, or indices on EBC's platform, the SMA can be applied to any timeframe chart. Day traders might use 5, 10, and 20-period SMAs on minute or hourly charts, while position traders could focus on 50, 100, and 200-period SMAs on daily or weekly charts.
The Simple Moving Average remains one of the most versatile and valuable tools in technical analysis, providing a clear visual representation of price trends that can form the foundation of various trading strategies across EBC Financial Group's range of tradable instruments.
Disclaimer: This material is for general information purposes only and is not intended as (and should not be considered to be) financial, investment or other advice on which reliance should be placed. No opinion given in the material constitutes a recommendation by EBC or the author that any particular investment, security, transaction or investment strategy is suitable for any specific person.


