The Fibonacci strategy is a well known tool used in the financial industry to find support and resistance. You need charting software to plot Fibonacci retracement levels and see support and resistance. It's based on the Fibonacci sequence, a series of numbers where each number is the sum of the two preceding ones (0, 1, 1, 2, 3, 5, 8 etc). This sequence gives us the golden ratio, approximately 1.618, a mathematical constant that appears in nature, art and financial markets. By using this ratio in trading we can better anticipate market moves and make more informed decisions. One of the most popular application of this is the Fibonacci retracement trading strategy where you identify trends and pick swing points to draw Fibonacci levels for trading.

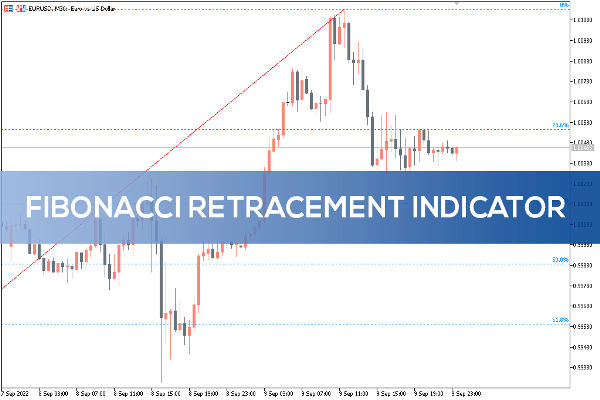
One of the most popular application of the Fibonacci strategy is the Fibonacci retracements. These retracements help you to identify areas where price might pause or reverse during a pullback in a trend. Key Fibonacci retracement levels like 23.6%, 38.2%, 50% and 61.8% are plotted on a price chart to see if a reversal is likely to happen. For example in an uptrend a pullback to one of these levels might be a buy and in a downtrend it might be a sell.
Beyond retracements the Fibonacci strategy also includes Fibonacci extensions which are used to project price targets beyond the current trend. Traders use extension levels like 127.2%, 161.8% and 261.8% to see where price might go after breaking a key support or resistance zone. This is useful for setting profit targets or identifying areas of strong resistance in uptrends or downtrends.
In practise traders combine the Fibonacci strategy with other technical indicators to make it more effective. Tools like moving averages, RSI (Relative Strength Index) and candlestick patterns are often paired with Fibonacci levels to confirm trading opportunities. For example if a Fibonacci retracement level aligns with a strong moving average or forms a candlestick reversal pattern it strengthens the signal for a trade.
Remember the Fibonacci strategy is a tool not a holy grail. Market conditions, news events and sudden changes in sentiment can affect price moves and make Fibonacci levels less reliable. So use it as part of a overall Trading plan that includes risk management and diversification.
By learning the Fibonacci strategy you can better navigate the markets and improve your ability to anticipate price moves. Whether it's forex or stocks, using Fibonacci retracements and extensions in your trading plan gives you a framework to find opportunities and manage risk.
What is Fibonacci Trading?
Fibonacci trading is a technical analysis method used by traders to predict price moves in financial markets. This is based on the mathematical principles of the Fibonacci sequence, a series of numbers where each number is the sum of the two preceding ones. Named after Leonardo Fibonacci, an Italian mathematician who introduced the Hindu-Arabic numeral system to Europe through his book "Libre Abaci" in 1202, the Fibonacci sequence has been applied to many fields including trading. By using Fibonacci trading strategies you can find support and resistance levels and set price targets for your securities. This gives you a framework to analyse the market and make more informed decisions. The Fibonacci retracement tool is used in this context to see potential support and resistance on price charts.
Fibonacci Ratios
Fibonacci ratios are the mathematical relationships derived from the Fibonacci sequence, a series of numbers where each number is the sum of the two preceding ones. These ratios are used to identify potential support and resistance levels in financial markets. The most common Fibonacci ratios are 23.6%, 38.2%, 50%, 61.8% and 78.6%. These percentages are derived from the Fibonacci sequence and are used to see potential retracement levels during trends.
To calculate Fibonacci Ratios:
Fibonacci Ratio = (Fibonacci Number / Previous Fibonacci Number)
For example the 23.6% Fibonacci ratio is calculated by dividing the 13th Fibonacci number (233) by the 12th Fibonacci number (144). This gives you a ratio that you apply to your charts to see potential support and resistance.
By plotting these ratios on a price chart you can see where a market might retrace or reverse. This gives you more power to make more informed decisions and navigate the markets.
Fibonacci Retracement Levels
Fibonacci retracement lines are horizontal lines on a chart that show where support or resistance might be. Each level is associated with a percentage that measures how much of a retracement has occurred from a previous high in the price action. These retracement percentages are based on the Fibonacci sequence. The main Fibonacci retracement levels are 23.6%, 38.2%, 50%, 61.8% and 78.6%. You can draw the indicator between any two significant price points, high and low, so it's a useful tool to find reversal zones and plan your trades.

Fibonacci in Trading
Applying Fibonacci to trading involves several practical ways to identify levels in the market. One of the most common is using Fibonacci retracement levels to see potential support and resistance. Traders draw horizontal lines on a chart at the Fibonacci ratios (23.6%, 38.2%, 50%, 61.8% and 78.6%) to mark these levels.
Another way is to use Fibonacci extensions to set price targets. Fibonacci extensions are calculated by multiplying the previous price swing by a Fibonacci ratio. For example if a market has moved from $10 to $20, a 61.8% Fibonacci extension would be calculated by multiplying the previous price swing ($10) by 1.618 (the golden ratio). This gives you a projection of future price moves and a realistic price target.
Fibonacci can also be combined with other technical analysis tools like trend lines and Chart Patterns to see potential trading opportunities. By combining Fibonacci retracement levels with other indicators you can confirm signals and make more robust decisions.
Fibonacci Extensions and Projections
Fibonacci extensions and projections are technical analysis tools to find support and resistance in the future price move of an asset. Fibonacci extensions estimate how far the price will move in the direction of the trend and Fibonacci projections find support and resistance. Both are based on the Fibonacci sequence and are used to set price targets for your securities. By using Fibonacci extensions and projections you can see future price moves and make more informed decisions and navigate the markets.
Fibonacci Trading Benefits and Drawbacks
Fibonacci trading has several benefits:
Find Support and Resistance: Fibonacci levels show you where the price might find support or resistance so you can get better entries and exits.
Set Price Targets: Fibonacci extensions give you a way to project future price moves so you can set realistic price targets.
Predict Reversals: By finding the key retracement levels you can see potential reversal points in the trend.
But Fibonacci trading has its drawbacks:
No Future Price Guarantee: Fibonacci levels are not foolproof and don't guarantee future price action.
Subjective: The interpretation of Fibonacci levels can be different among traders so you get different answers.
Market Volatility: External factors and market volatility can make Fibonacci levels unreliable.
To overcome these limitations traders should use Fibonacci with other technical analysis tools and have robust risk management. This way you make more informed decisions and manage risk better.
By using and applying Fibonacci ratios you can see more market moves and make more strategic decisions. Whether used alone or with other tools Fibonacci trading gives you a framework to navigate the markets.
Fibonacci with Other Indicators
Fibonacci retracement levels are more powerful when used with other technical indicators. Common indicators that go well with Fibonacci retracement levels are moving averages, Relative Strength Index (RSI) and Bollinger Bands. By combining these you can improve your trades and make more informed decisions. Also combining Fibonacci retracement levels with other forms of analysis like fundamental analysis and market sentiment analysis gives you a bigger picture of the market. This way you can confirm trading opportunities and manage risk better and get better results.
Disclaimer: This material is for general information purposes only and is not intended as (and should not be considered to be) financial, investment or other advice on which reliance should be placed. No opinion given in the material constitutes a recommendation by EBC or the author that any particular investment, security, transaction or investment strategy is suitable for any specific person.


